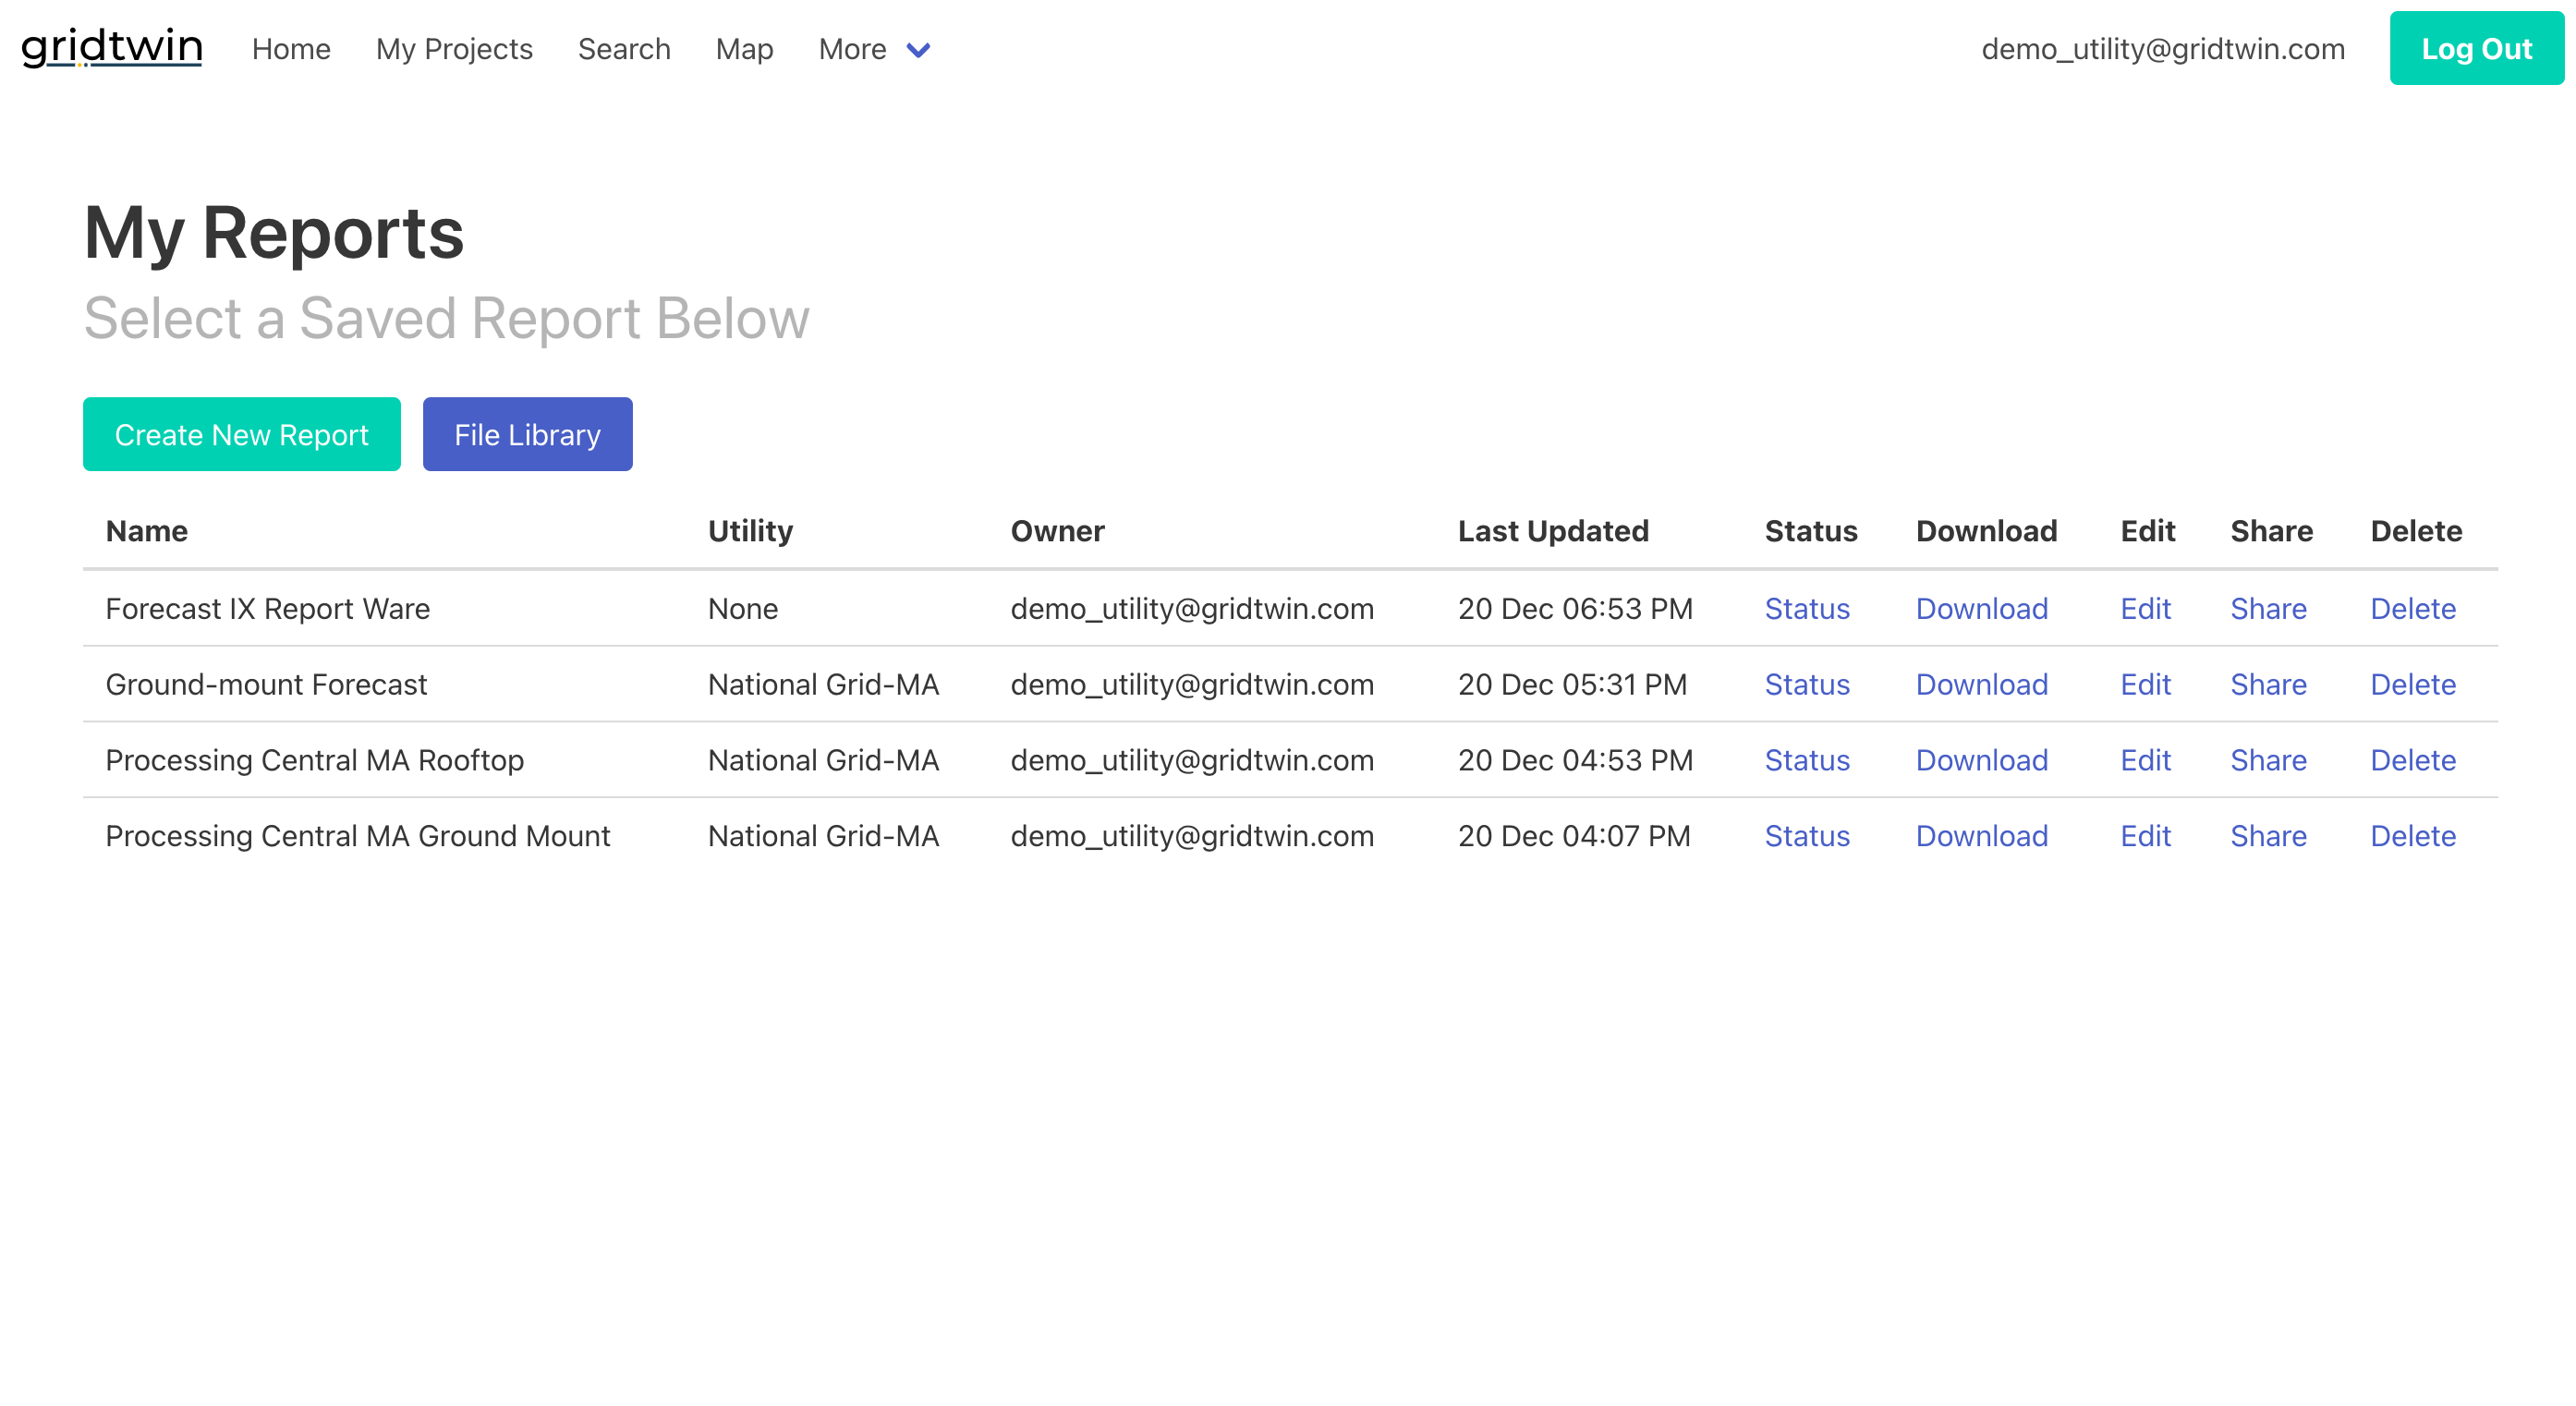
Training & Tutorials — Utility Forecasting
Utility tutorials for forecasting DER deployment and reviewing forecast results.
Forecasting Overview
Gridtwin forecasting predicts where, when, and how DERs are most likely to be developed — and what their interconnection will cost — before projects are built. Standardized data and models turn a multi-month effort into a repeatable, configurable run.
- Rank millions of potential projects on their economics (20-year IRR)
- Simulate year-over-year deployment against real network constraints
- See per-substation and per-feeder MW and the upgrades they trigger
- Slice results by site, year, feeder/substation, and cost
Steps
- Confirm objectives for the forecast
- Identify datasets and assumptions
- Run parcel processing, then the solar forecast
- Interpret results and sanity-check against assumptions

Step 1: Gather and Standardize Data
Gridtwin ships the standard layers, so a forecast can run with minimal input; the utility supplies the territory-specific layers that define real capacity, costs, and economics.
- Standard layers from Gridtwin — parcels, land cover (NLCD), elevation (USGS DEM), and solar resource
- Utility-specific layers — network data and ratings, hosting capacity, interconnection cost catalogs, and financial parameters
- Environmental, conservation, and cultural exclusion layers
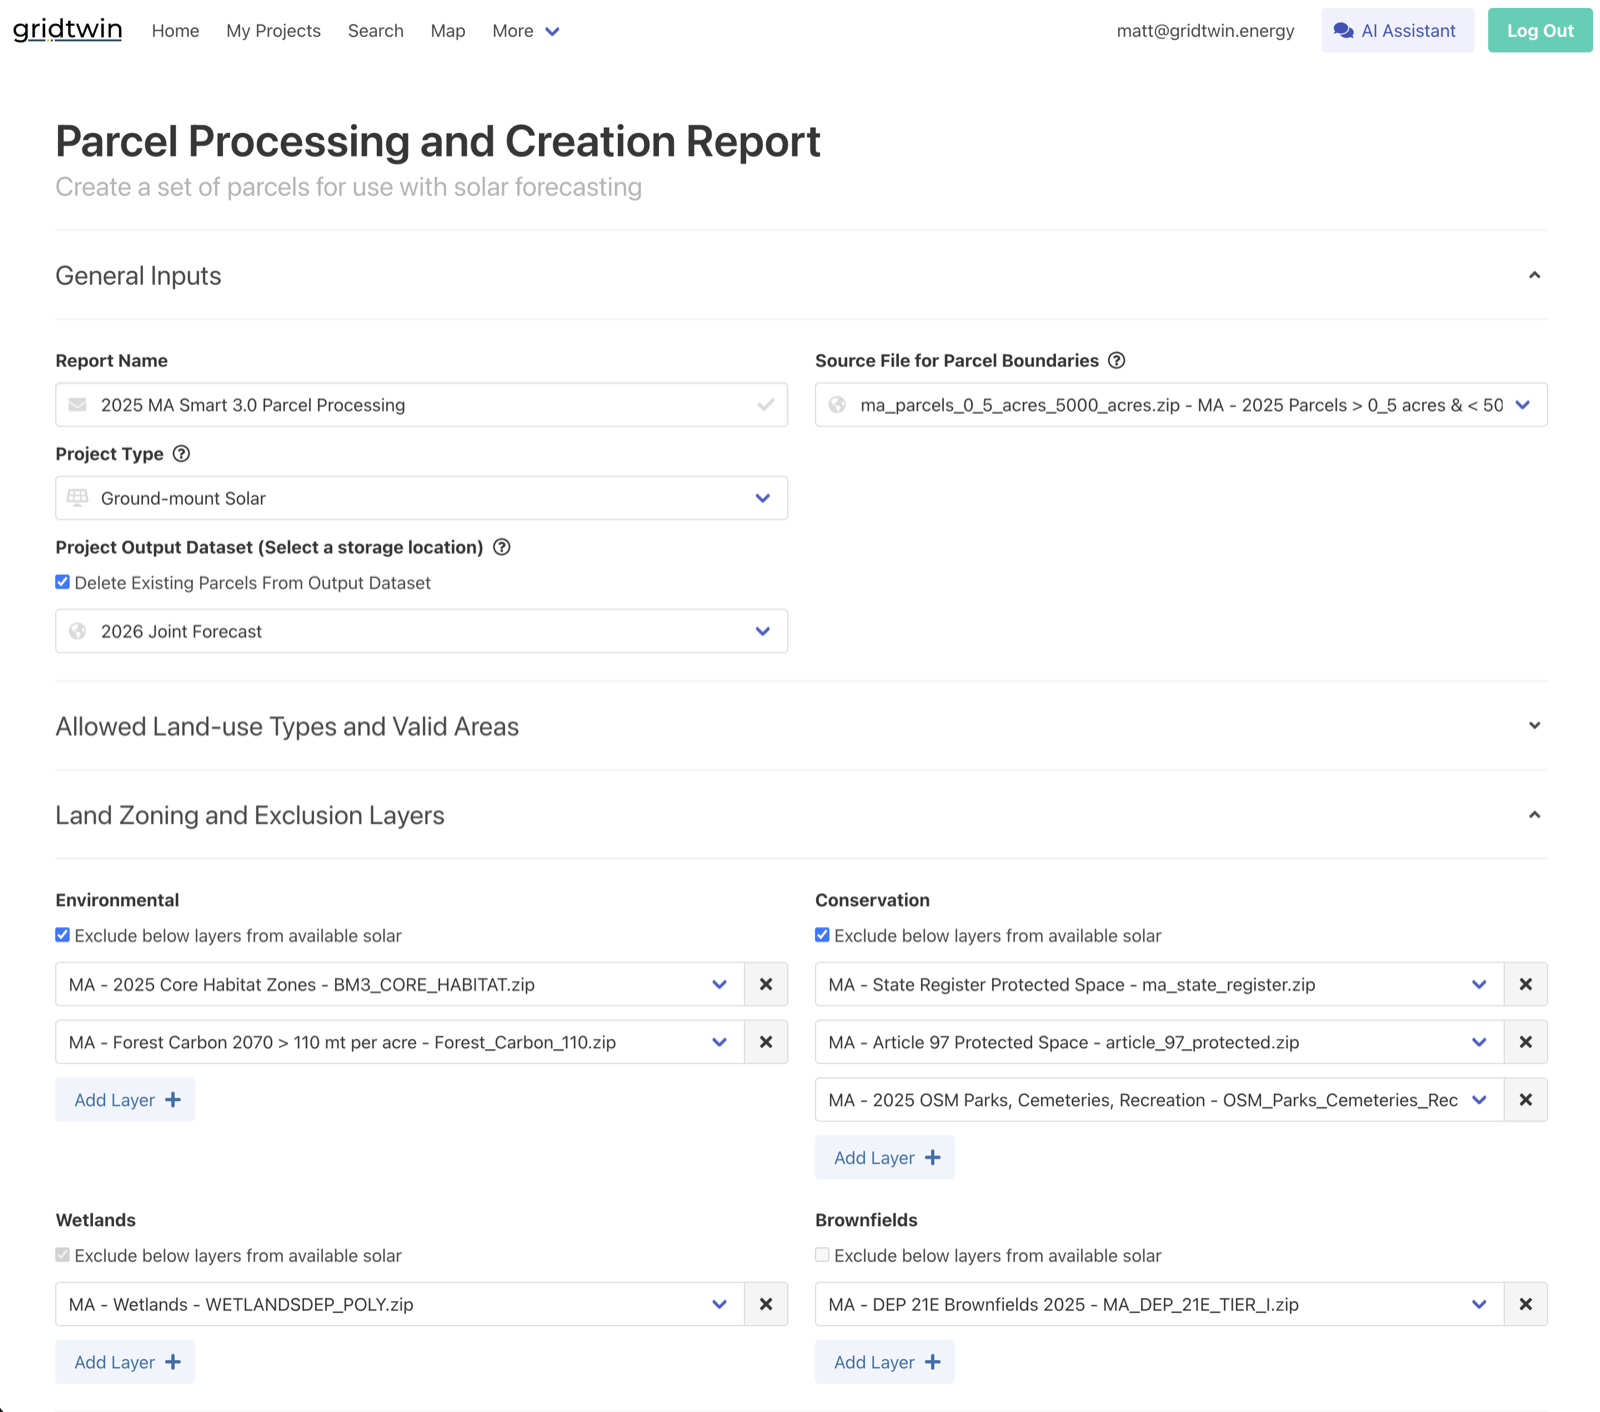
- Uploads live in the shared file library — filtered by state, utility, and layer type, and reused across reports and forecasts
Steps
- Review the standard datasets for your territory
- Upload utility-specific inputs to the file library
- Validate schemas and geographies
- Point reports at the correct datasets
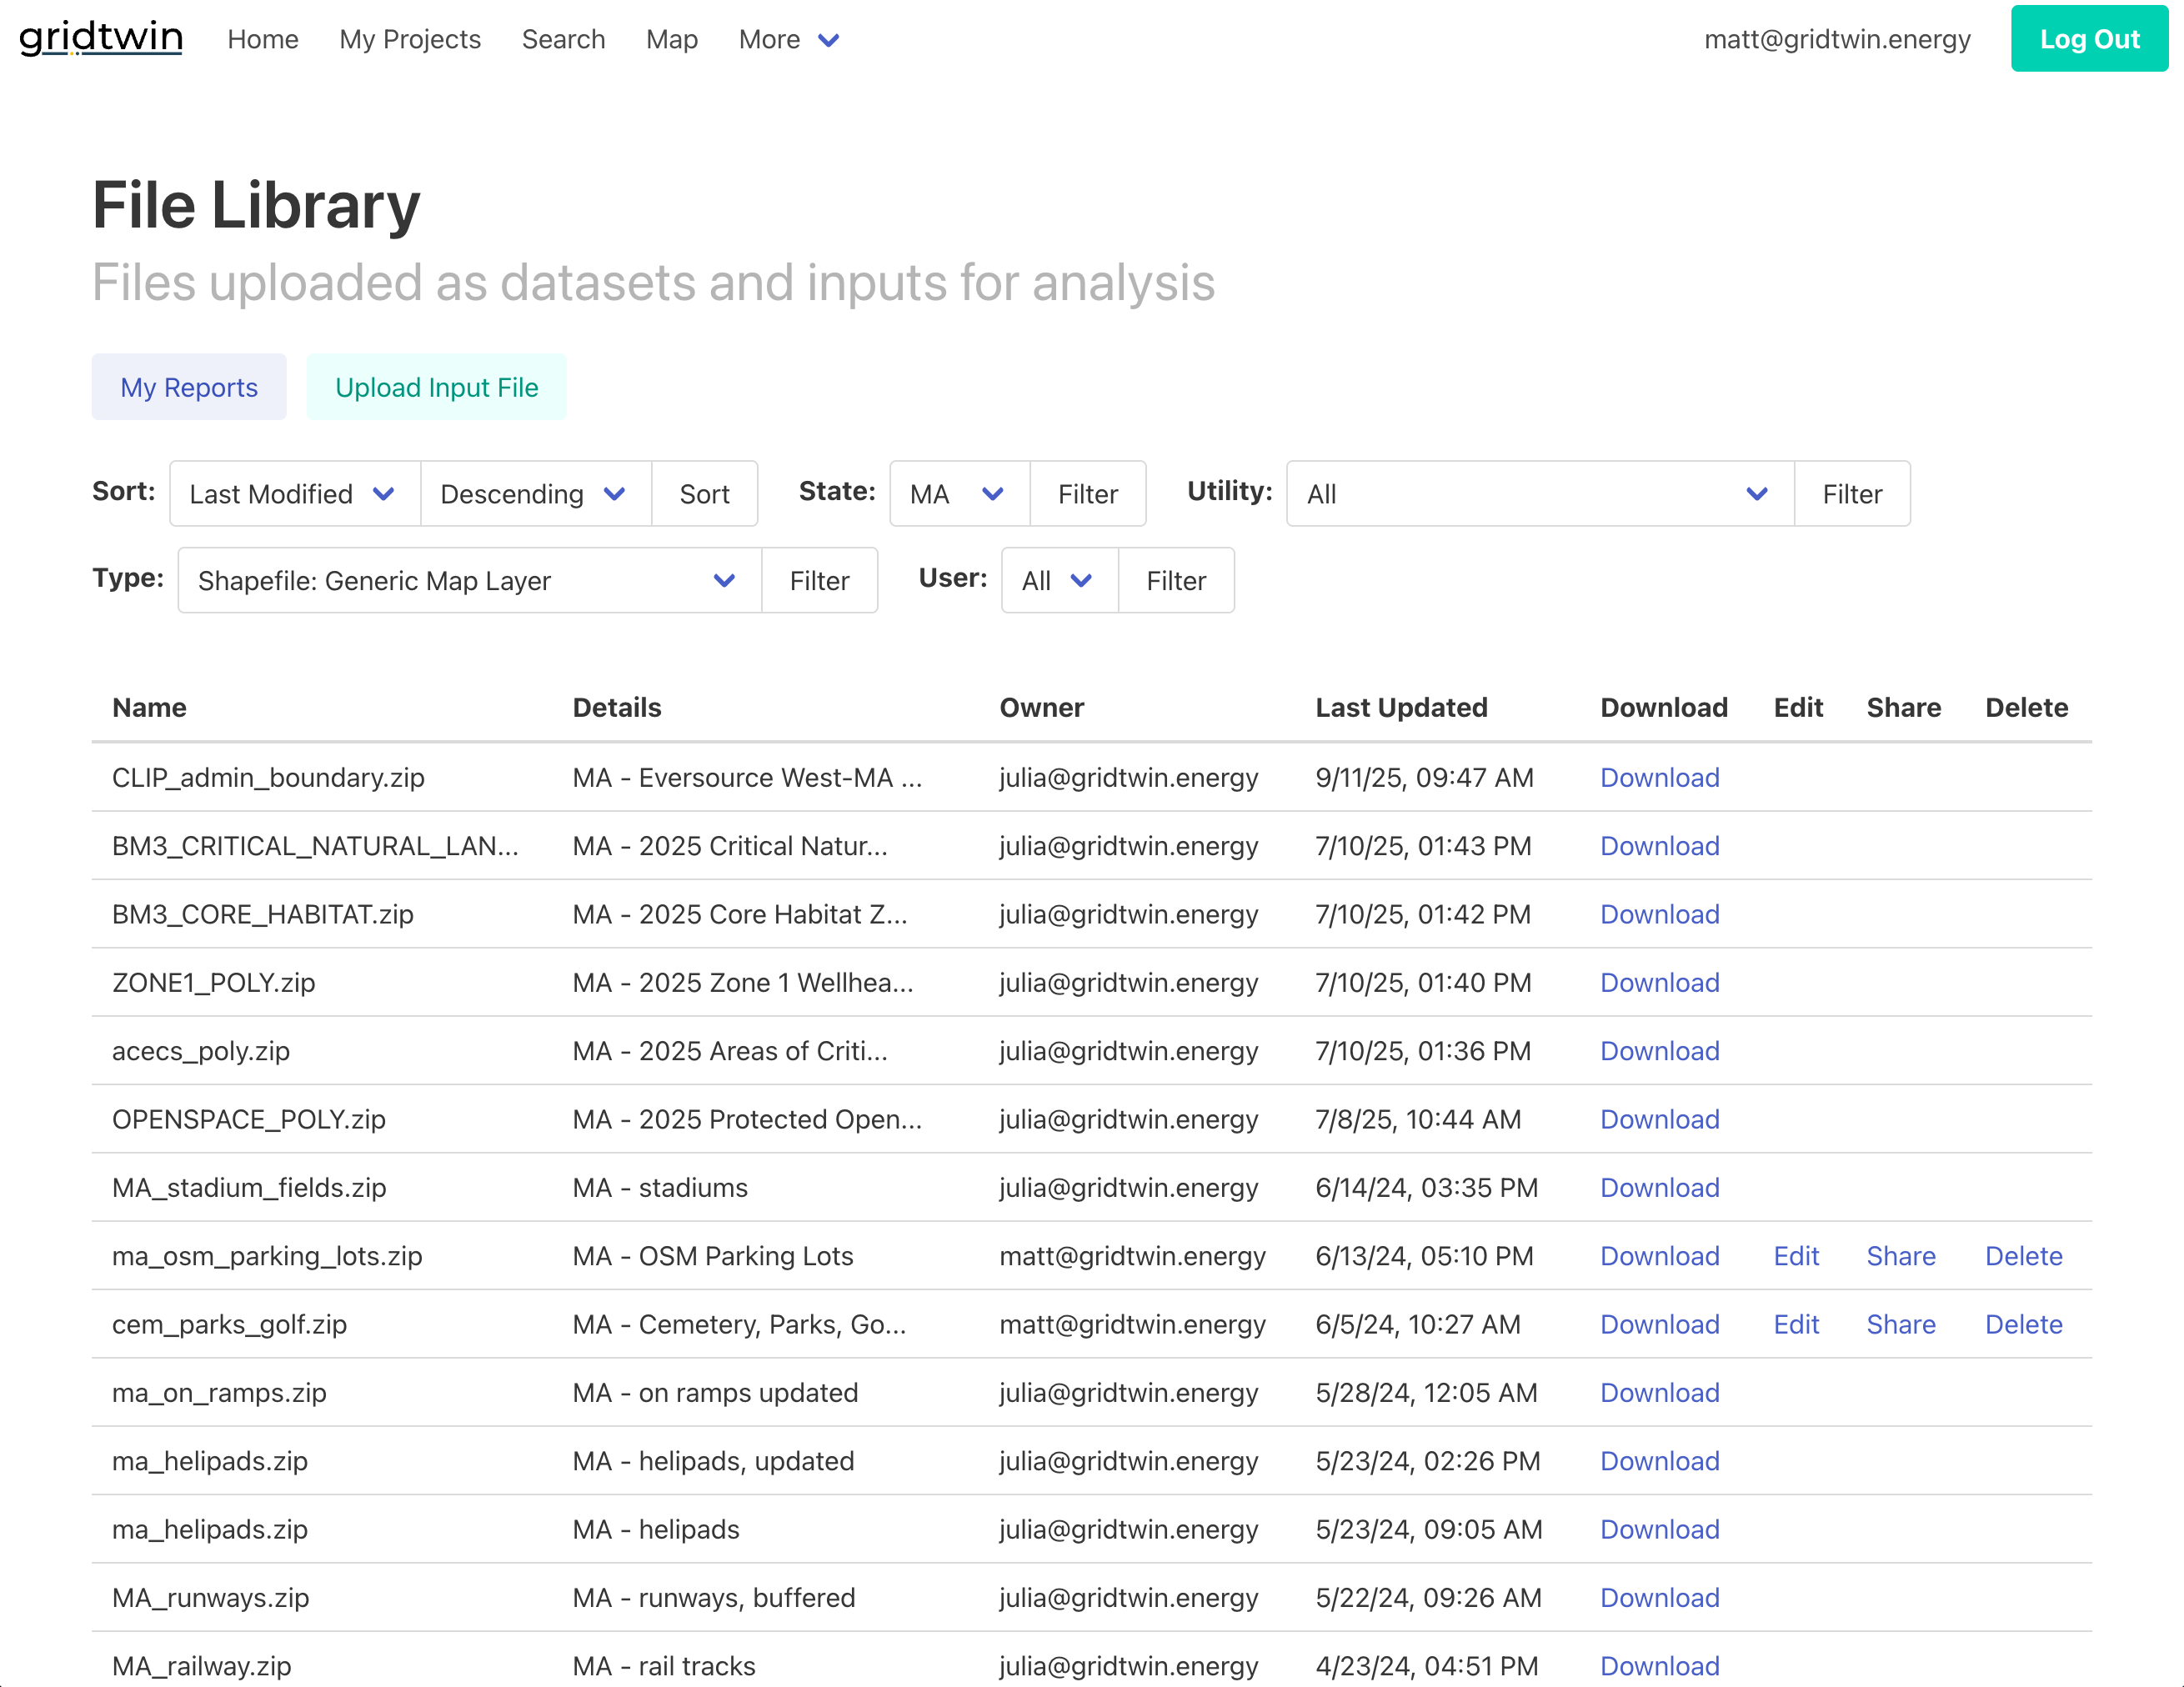
Step 2: Parcel Processing — Characterize and Price Every Site
The Parcel Processing & Creation report turns every parcel in the territory into a characterized, priced candidate site — the foundation the forecast ranks on.
- Land use → buildable area, with exclusions and setbacks clipped out
- Terrain → slope and aspect; solar resource → capacity factor
- Sizing → MW potential from the buildable area
- Network → nearest feeder and substation, with distances and hosting capacity
- Interconnection → cost to connect, priced from the cost catalog
- Economics → a 20-year IRR and NPV for every parcel
Steps
- Run the Parcel Processing & Creation report
- Choose the parcel source, project type, and allowed land uses
- Layer in environmental, wetland, and brownfield exclusions
- Review the resulting candidate dataset
Step 3: Build and Rank the Candidate Pool
Before deployment is simulated, the candidate pool is filtered and ranked into a merit order against the live network.
- Filter on project size, slope, coverage, distances, interconnection cost, and a minimum 20-year IRR
- Drop parcels too close to existing solar
- Re-price every surviving candidate against the current network
- Rank descending by interconnection-adjusted IRR — the merit order
Steps
- Set viability thresholds and filters
- Gridtwin ranks the pool by 20-year IRR
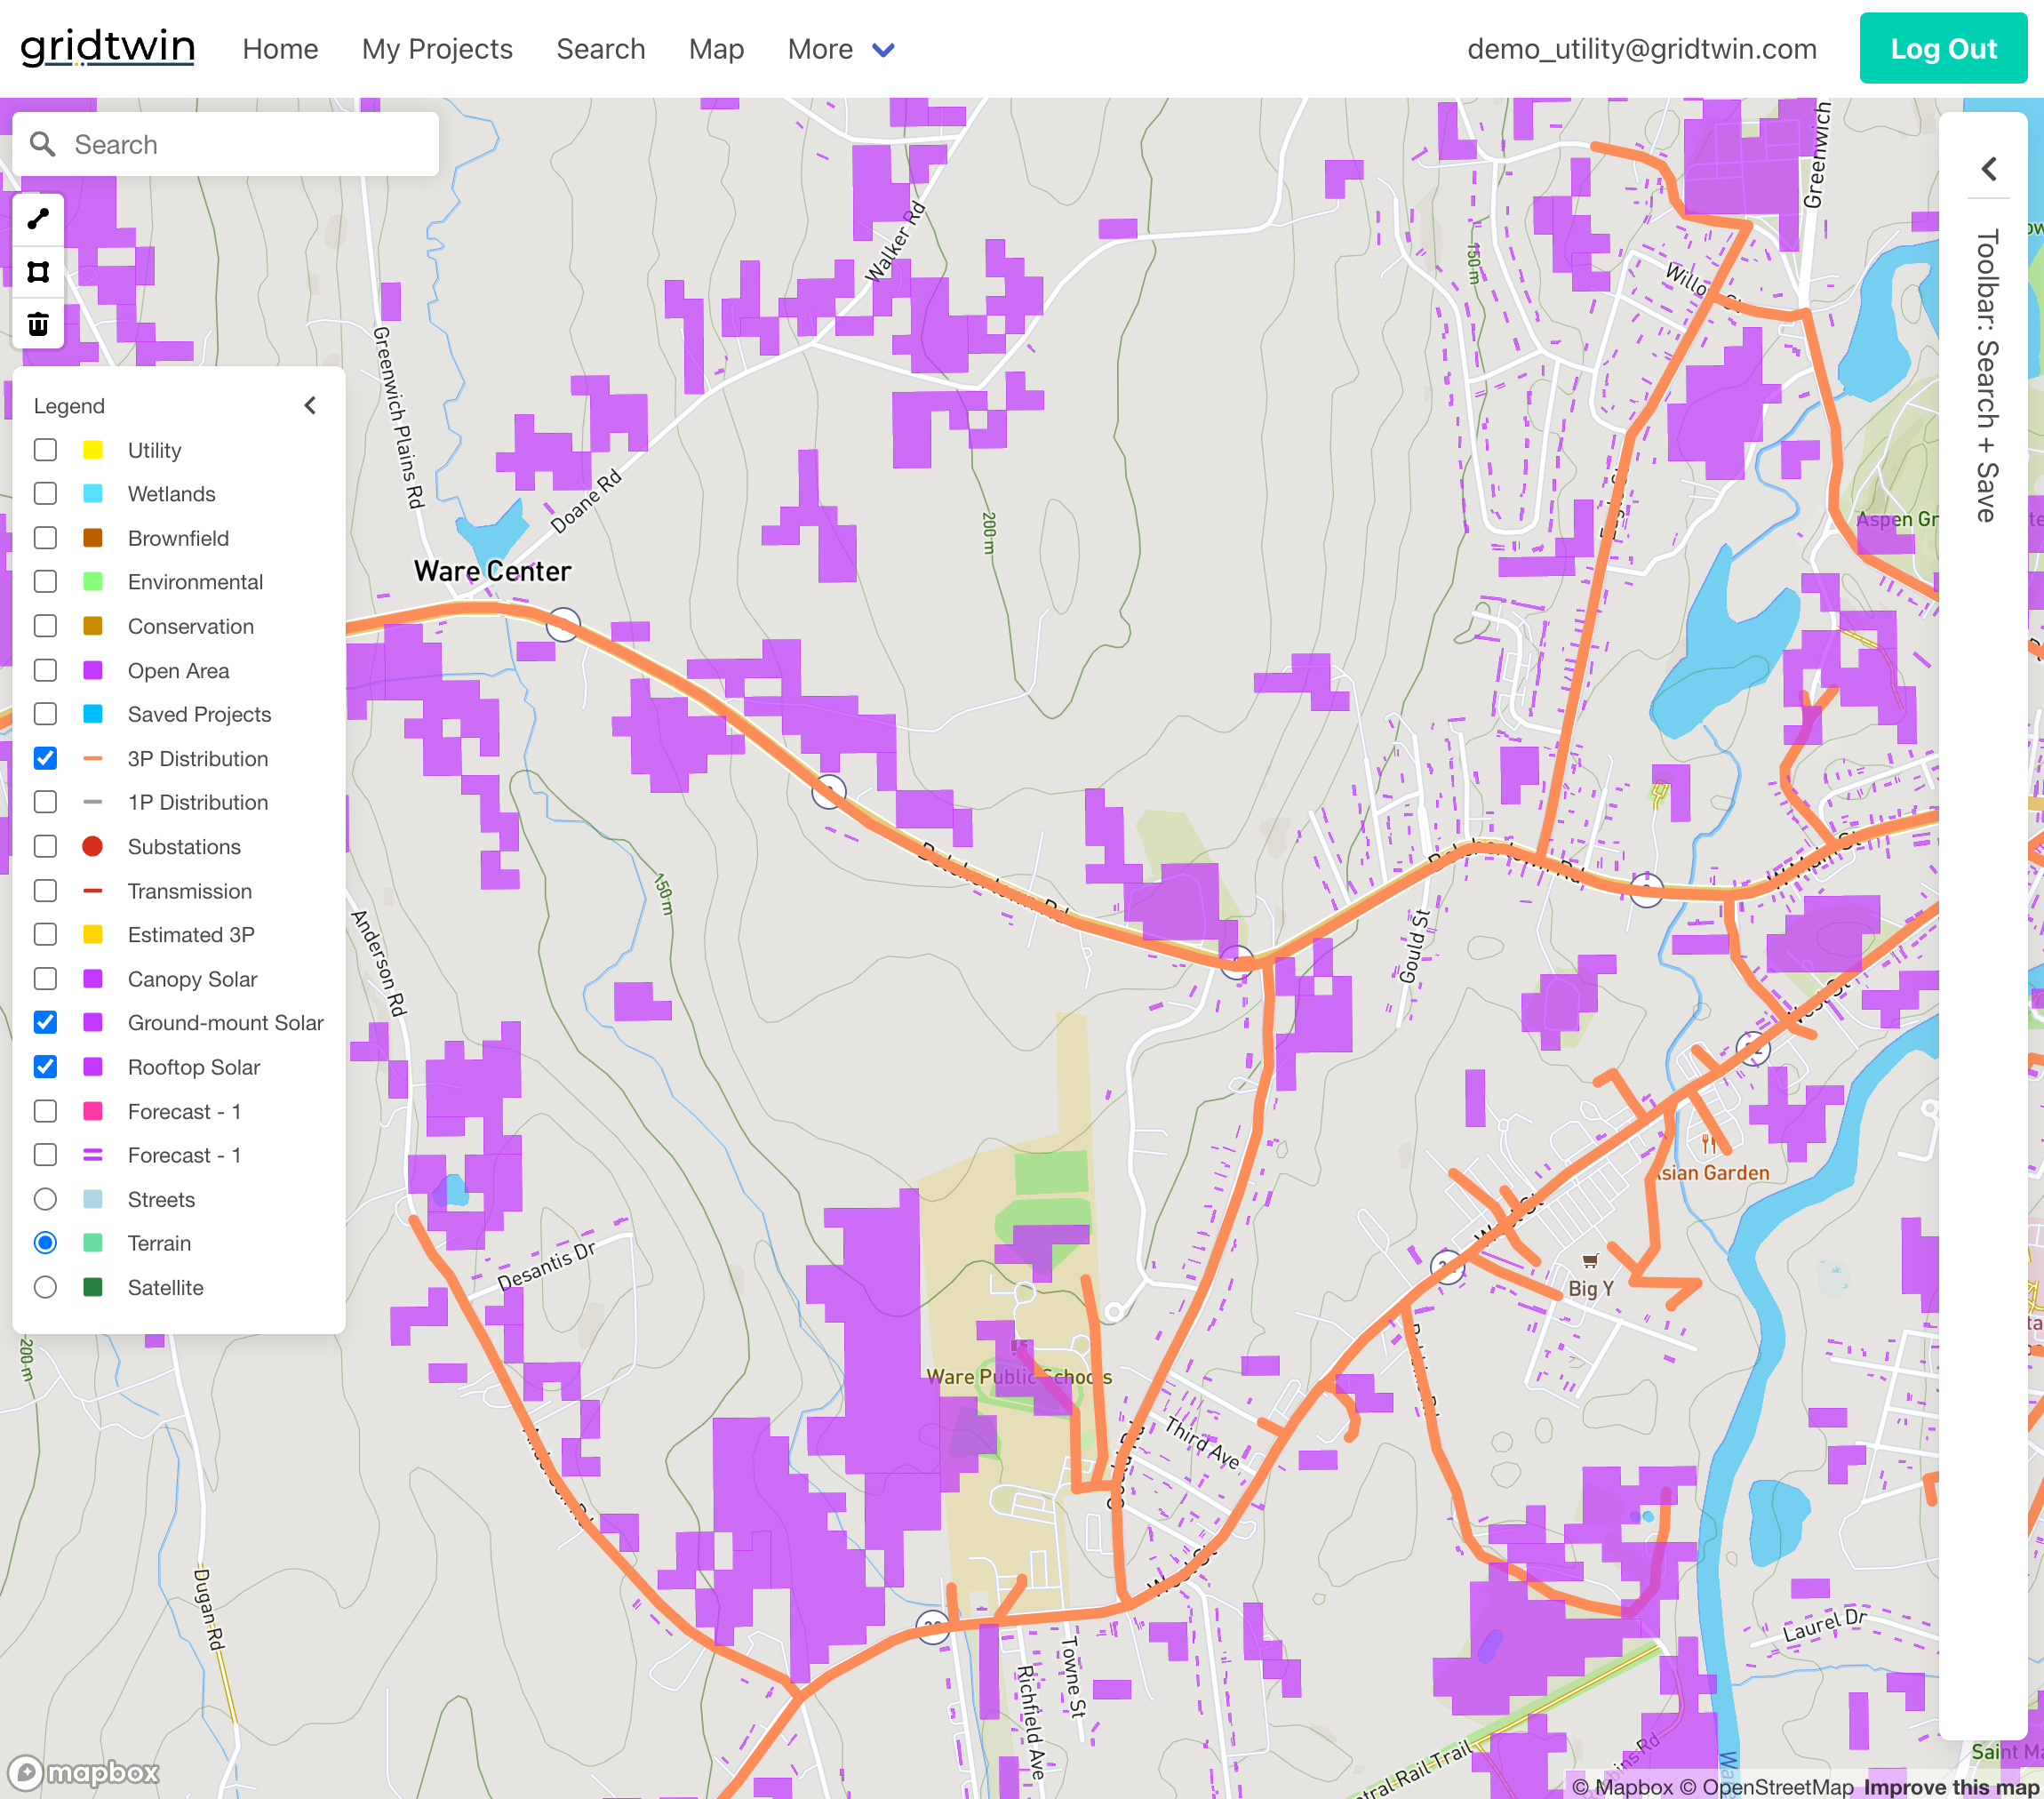
Step 4: Forecast Deployment Over Time
The forecast connects projects one at a time, in merit order, while the network state updates around them — each connection changes what the next selection sees.
- Apply annual MW deployment targets, processed in ascending years
- Connect the best site and draw down its feeder and substation hosting capacity
- Re-price and re-rank same-substation neighbors after every connection
- Schedule triggered upgrades — their added capacity unlocks in a later year
- Continue until each year's target is met; a year can underfill if capacity runs out
Steps
- Set annual MW targets across the deployment horizon
- Tune substation and feeder expansion behavior
- Run the Solar Forecast report
- Review the deployment timeline
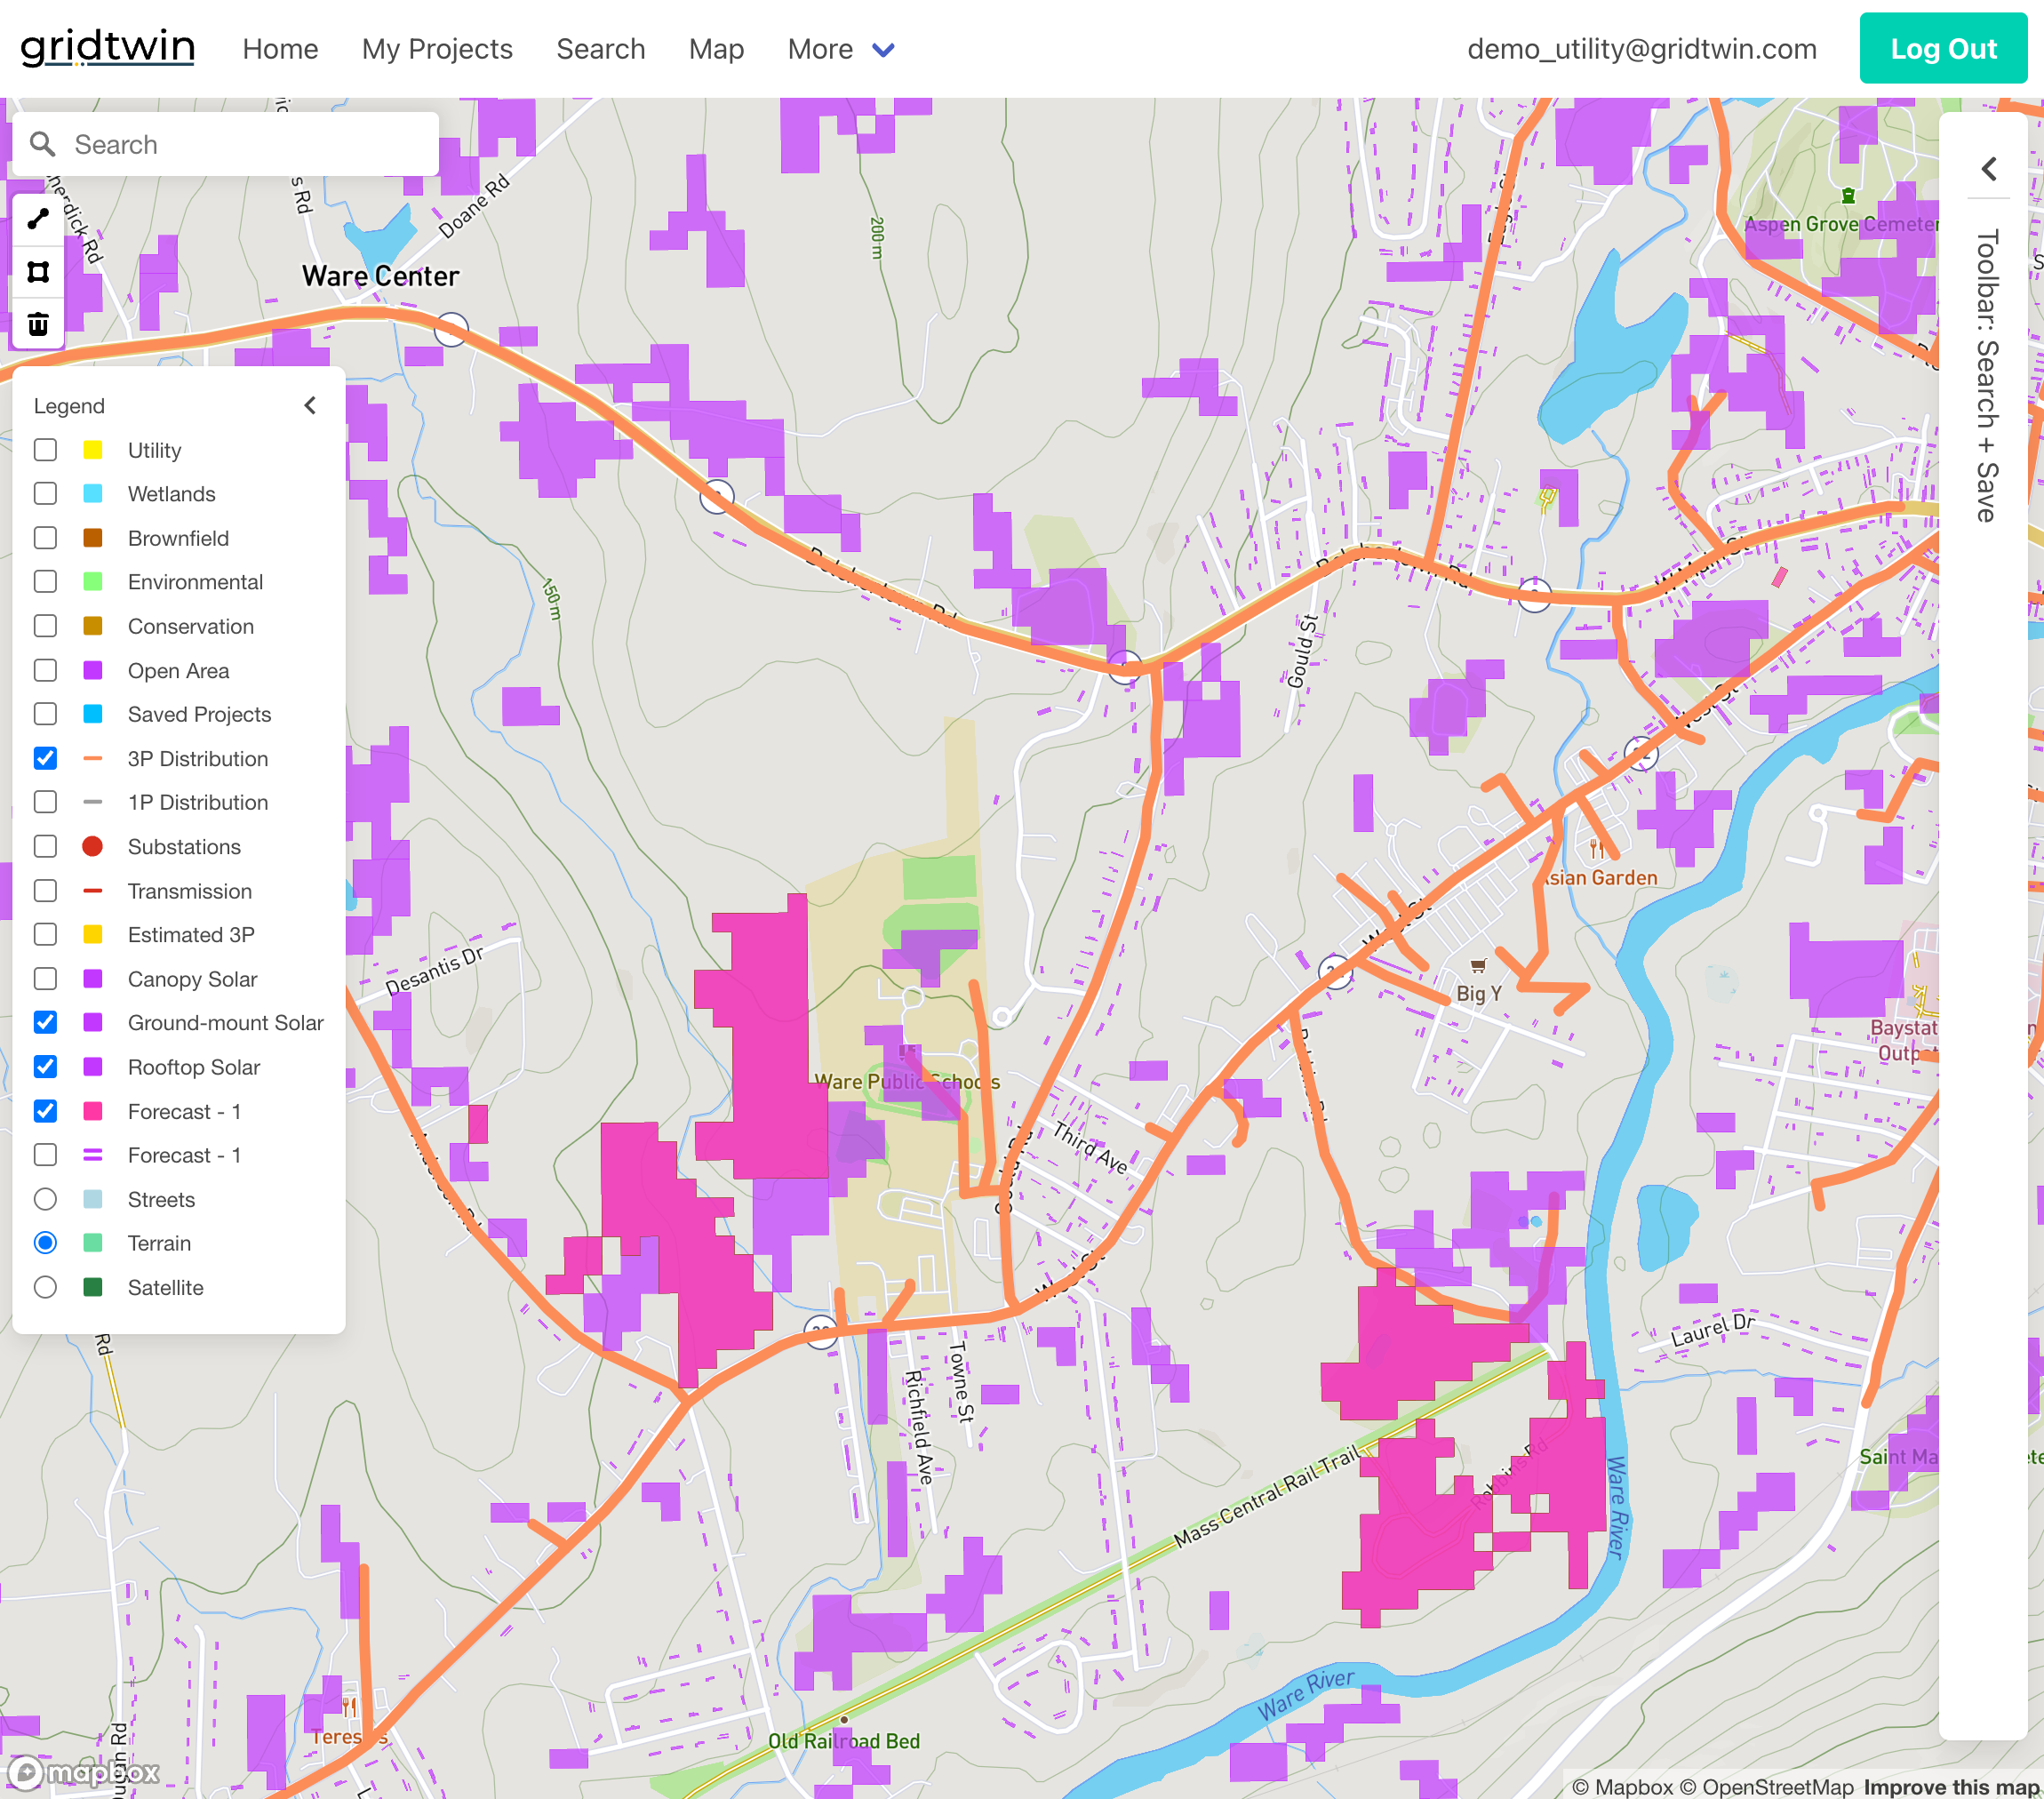
Modeling Network Constraints
Detailed feeder and substation models keep the forecast honest about grid limitations. Interconnection costs in a forecast are transparent screening estimates priced from cost catalogs — a heuristic, not a full power-flow study.
- Automatic routing of new service lines
- Feeder and substation capacity gates what can connect, and when
- Two capacity registers — capacity available now, and capacity a scheduled upgrade unlocks later
- Configurable upgrade increments and delays for substations and feeders
- Multi-utility (joint) forecasts — one merit order across territories, each parcel priced with its own utility's catalog
Steps
- Review feeder and substation limits and fallbacks
- Configure upgrade triggers, increments, and delays
- Validate sample scenarios
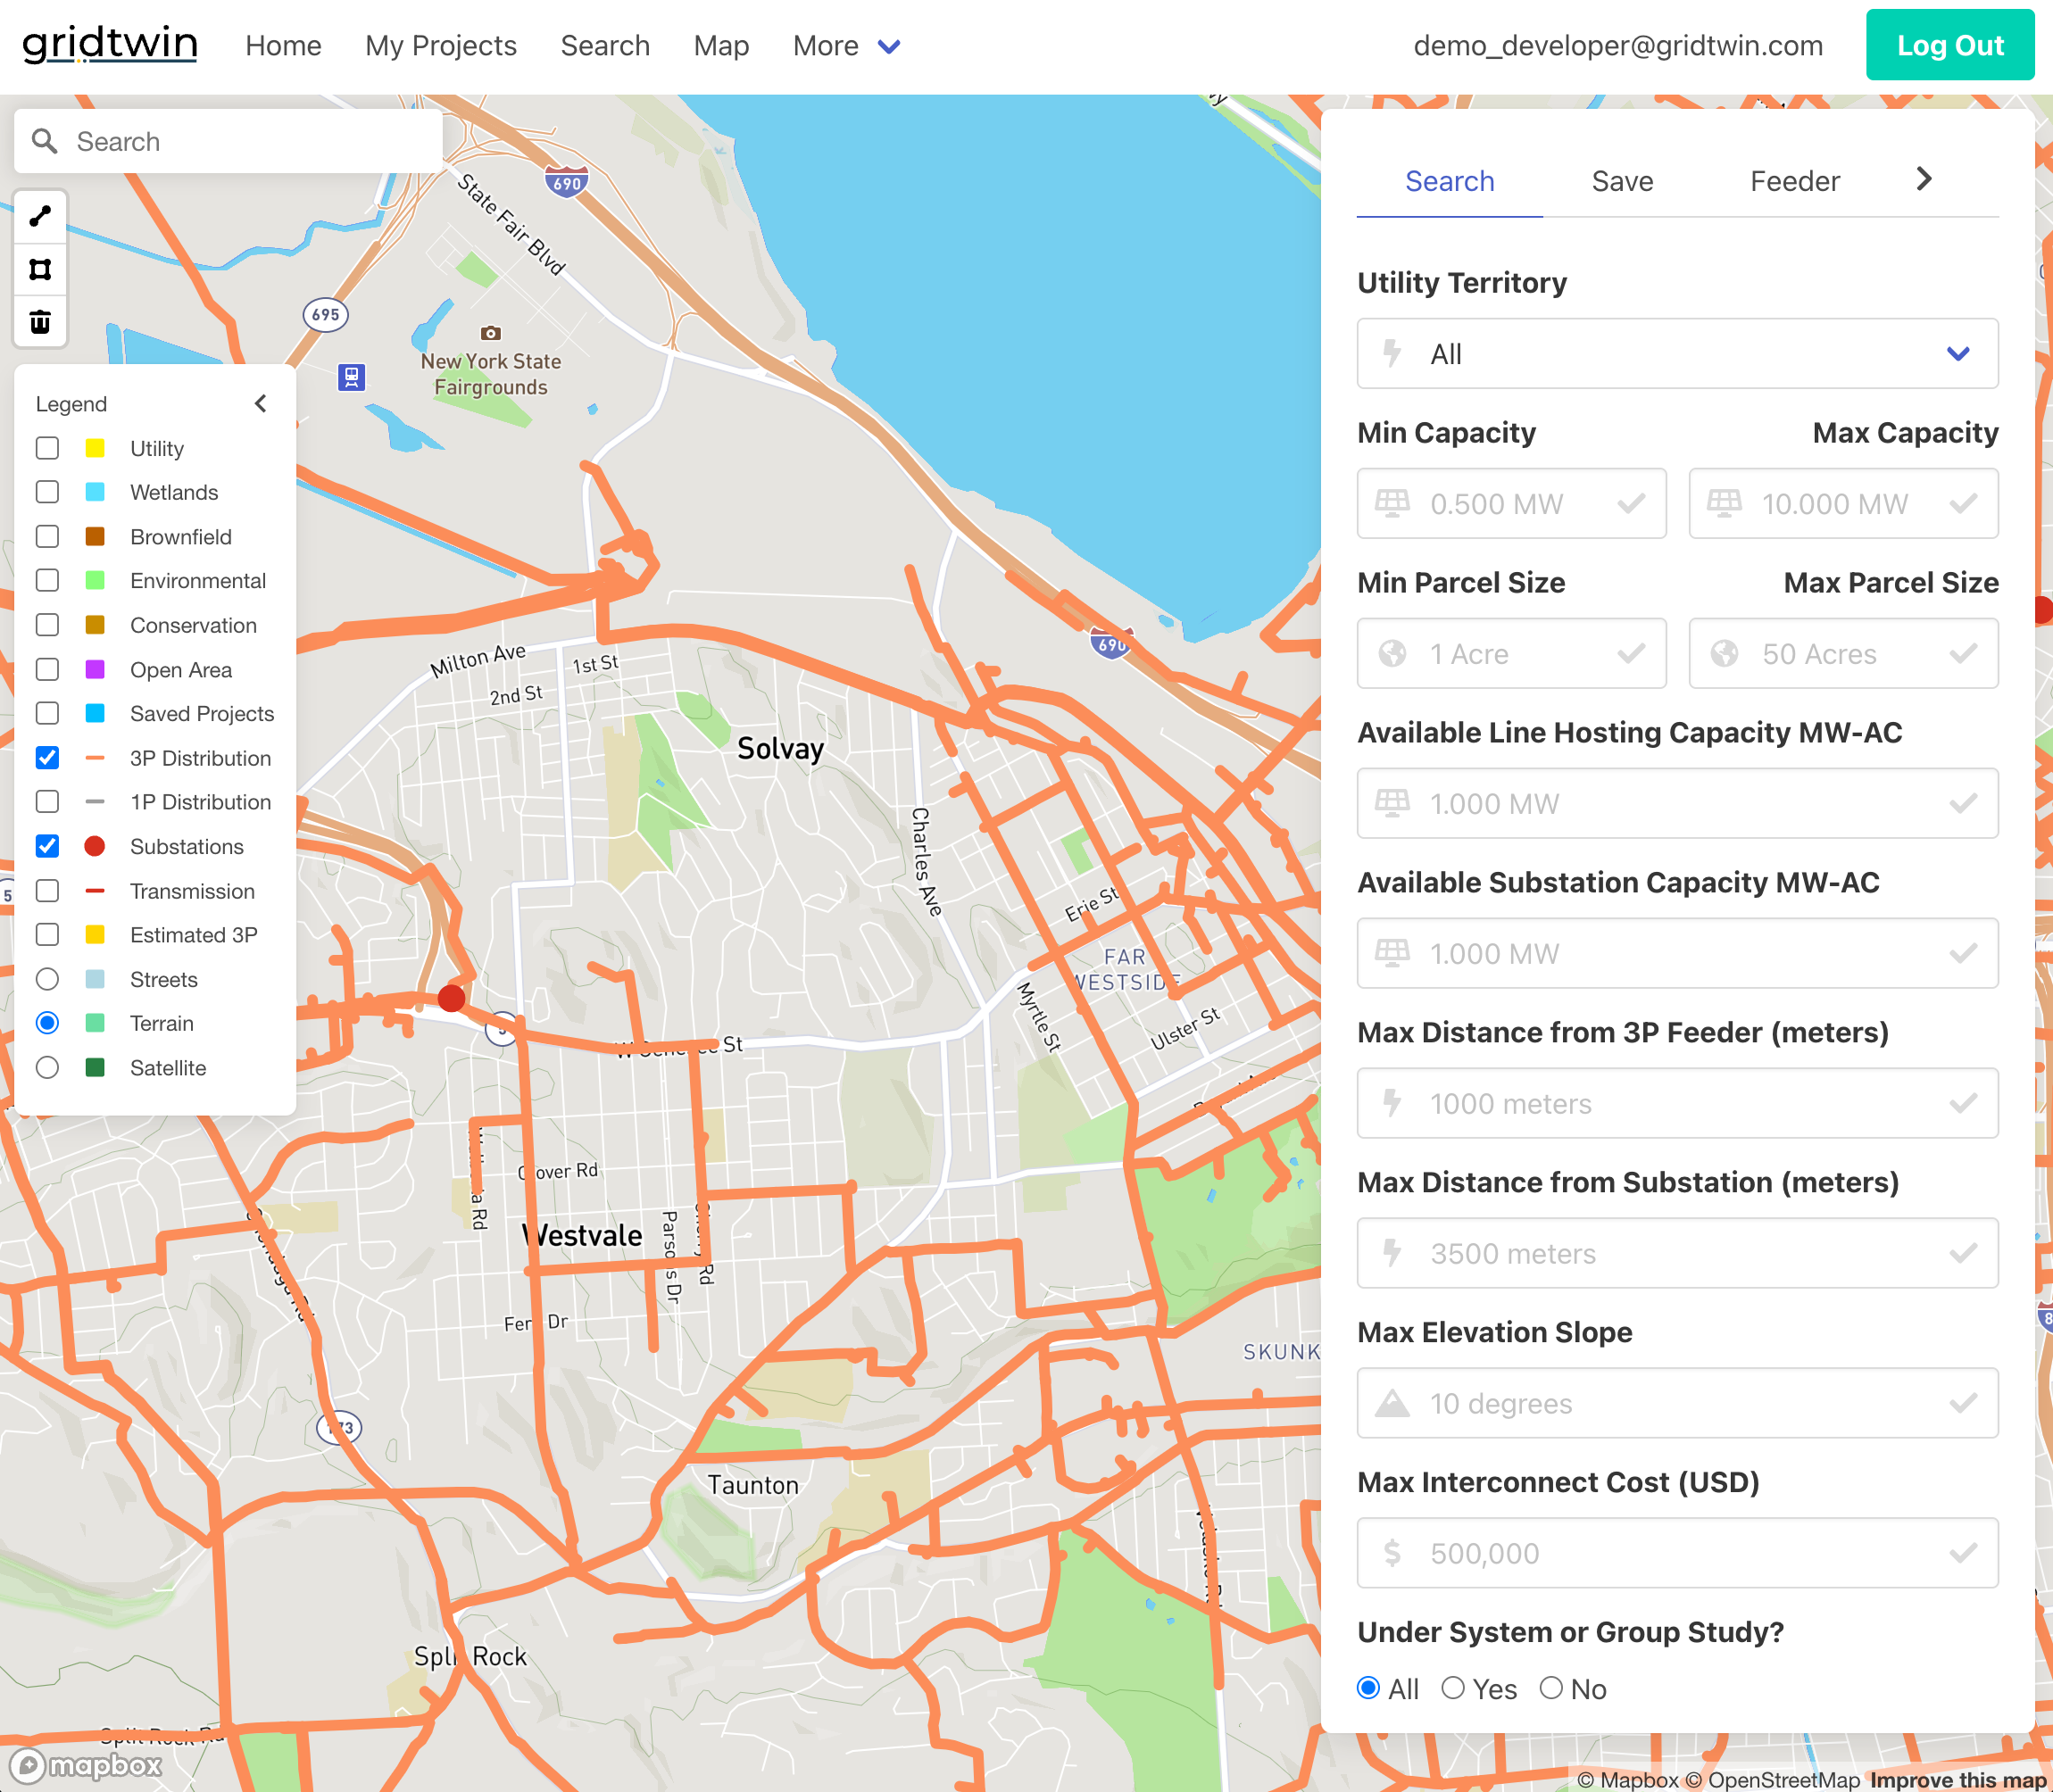
Technologies Covered in Forecasts
Gridtwin forecasting models support the DER technologies relevant to distribution utilities, each at an appropriate spatial scale.
- Ground-mount solar — parcel-based IRR
- Canopy and commercial rooftop solar — IRR per site
- Residential rooftop solar — propensity models
- Public and residential EV charging — propensity models
Steps
- Select the technologies in scope
- Confirm spatial resolution needs
- Prepare technology-specific inputs
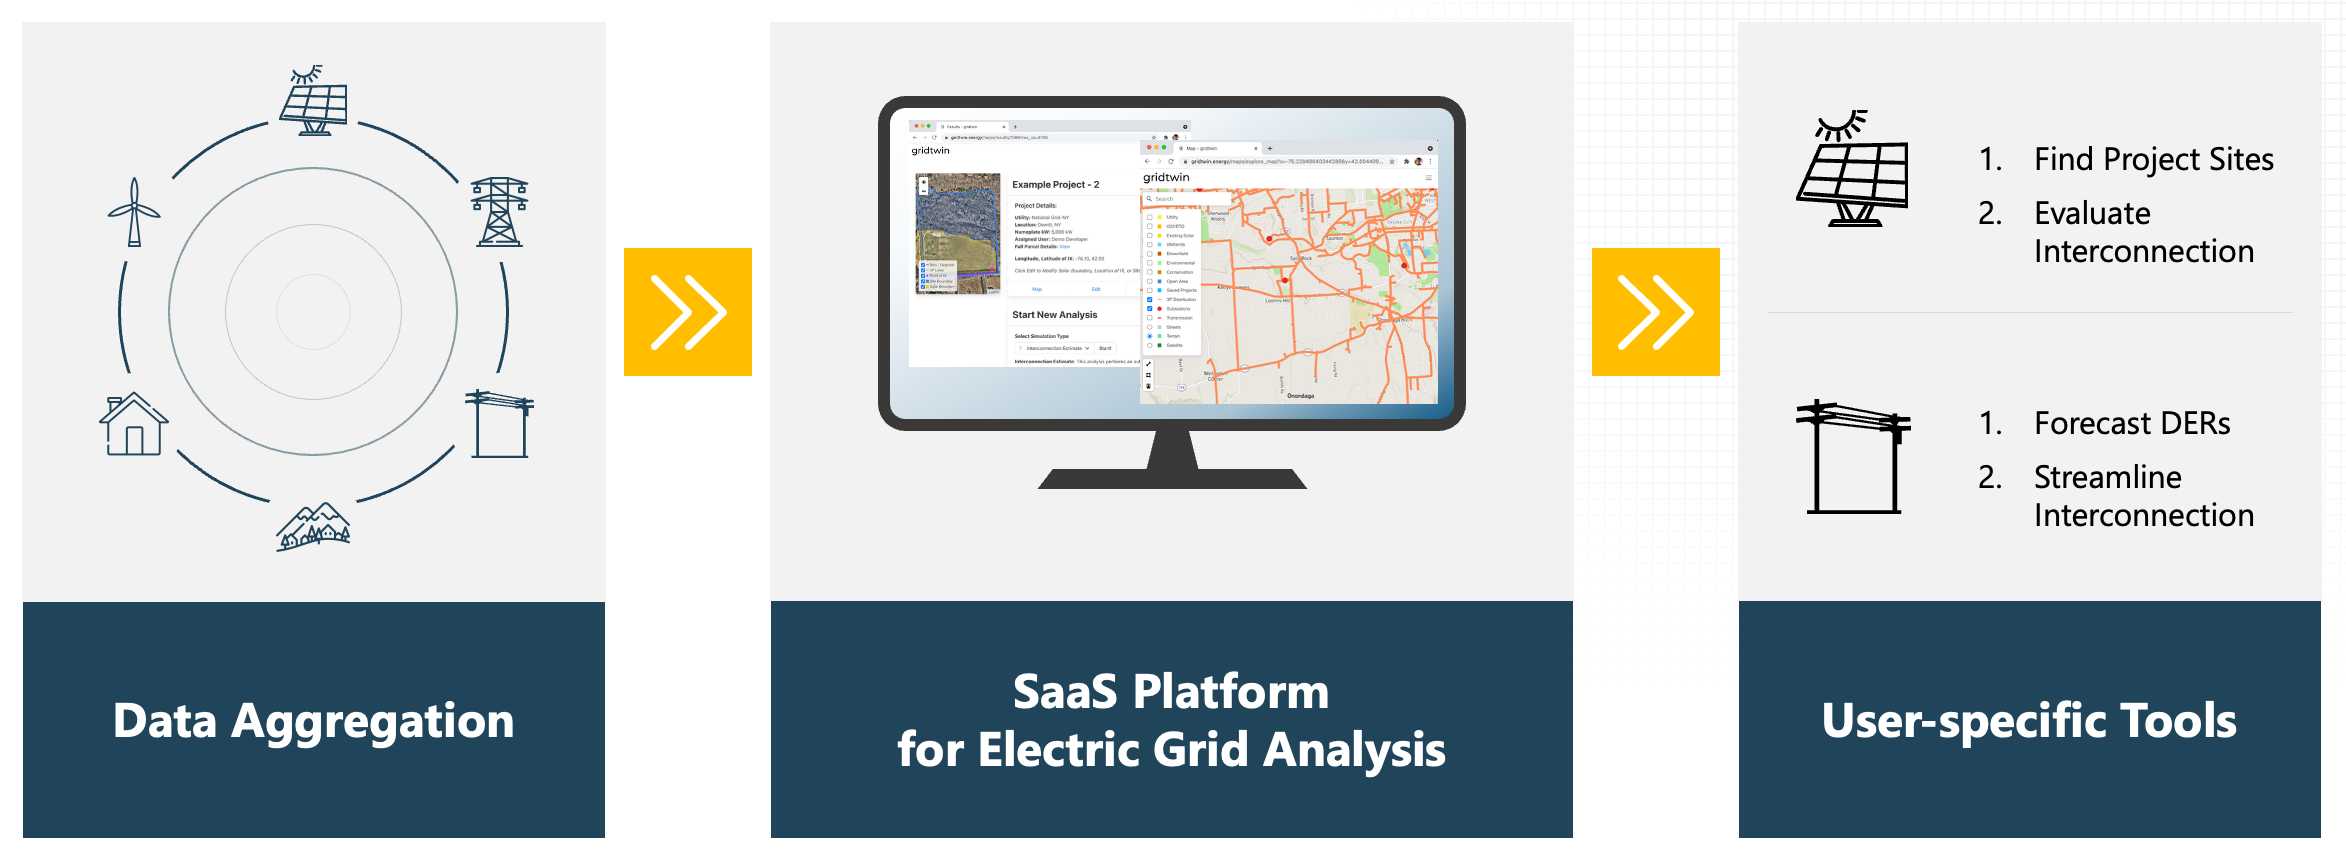
Forecast Outputs and Reports
A completed forecast produces three output files, plus charts and maps in the report viewer — everything exportable for planning and regulatory use.
- forecast.csv — every forecasted project with its year, order, IRR, and cost
- substation_data.csv — sited MW and scheduled upgrades per substation
- feeder_data.csv — per-feeder sited MW and remaining capacity
- Charts and maps in the report viewer for review and sharing
Steps
- Open results in the report viewer
- Export the output files
- Share results with stakeholders