
Interconnection analysis, in minutes
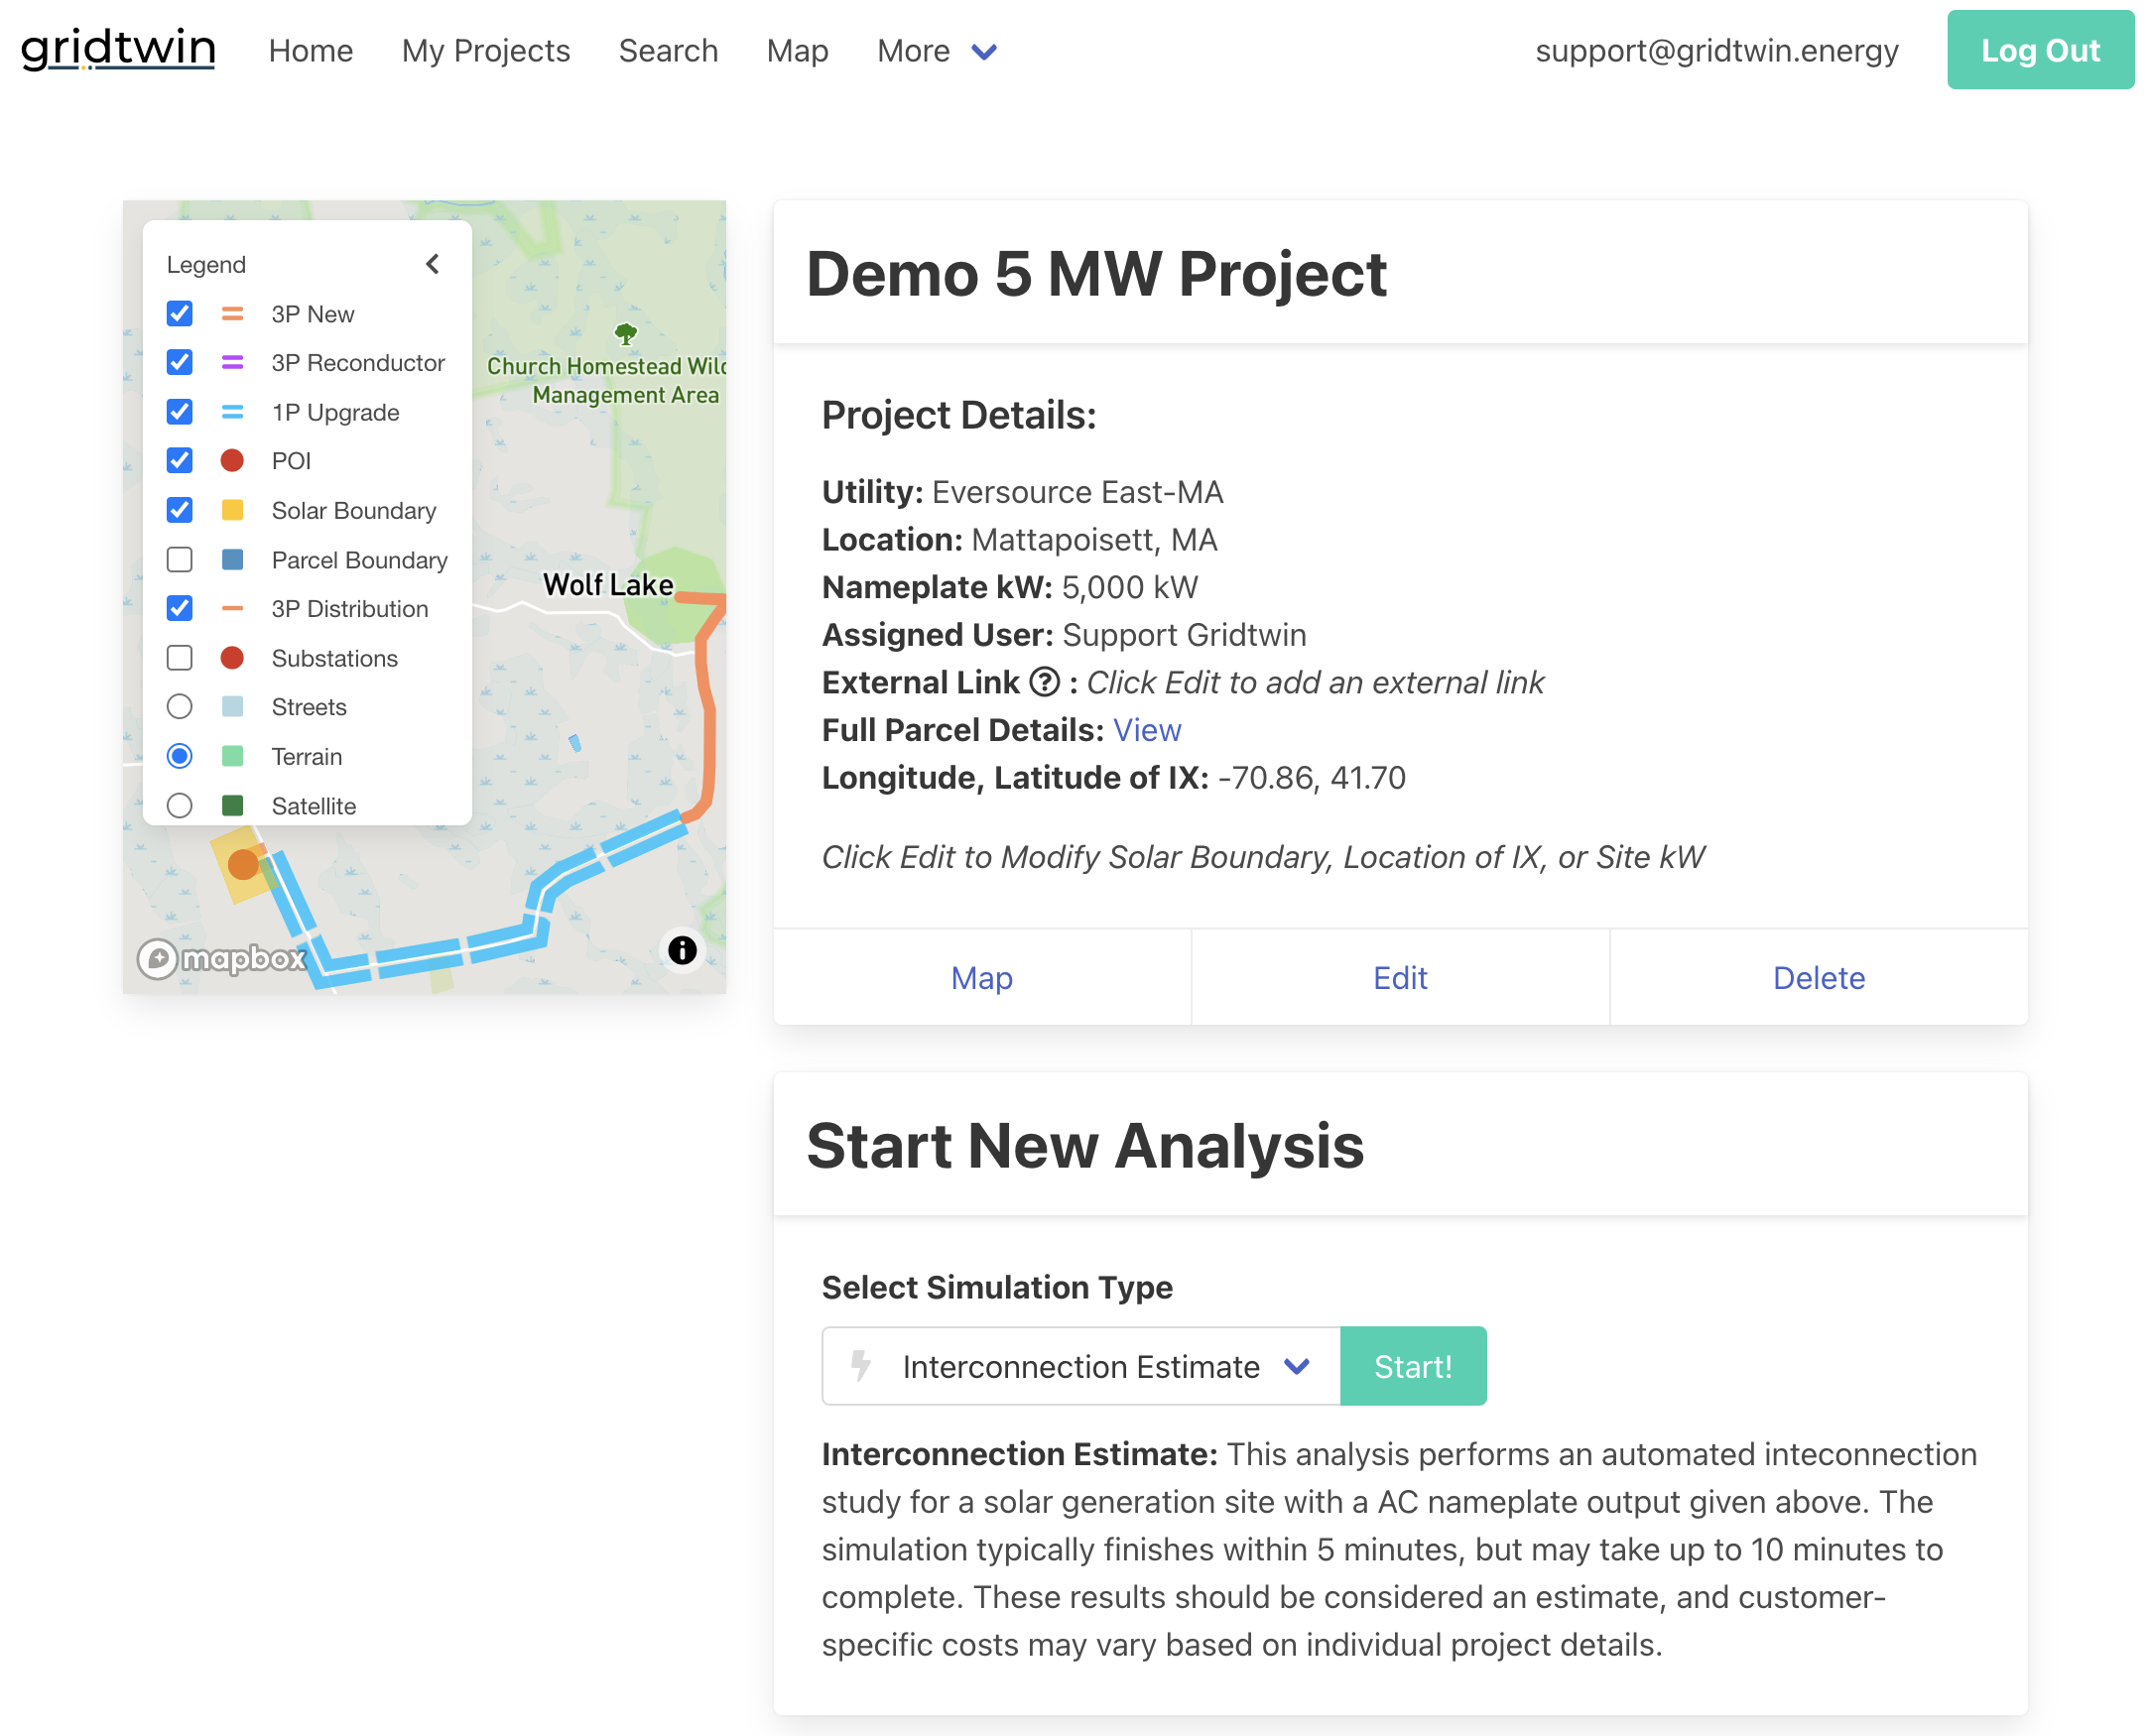
An automated analysis models your project's impact on the local distribution network and returns the grid upgrades and costs required to connect it — in minutes rather than months.
What you get back
- A status and written summary of the study
- The estimated connectable capacity (MW) at the modeled point
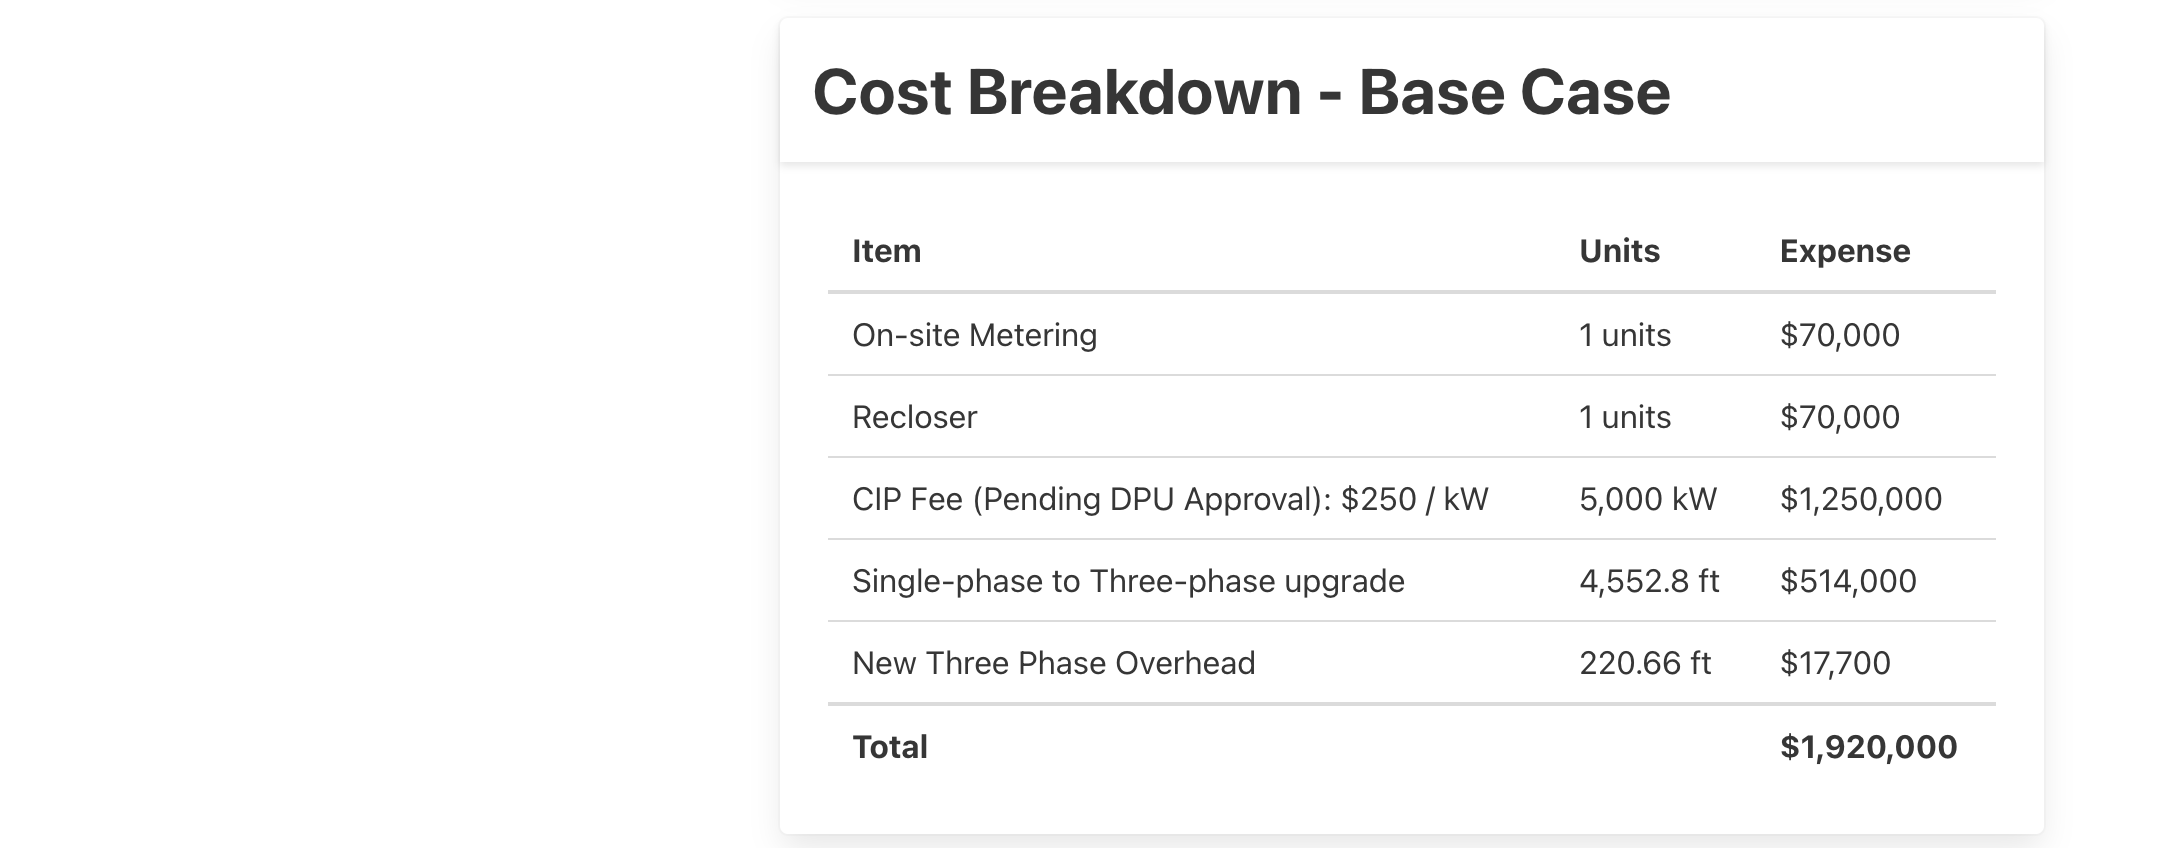
- A Bill of Materials — every upgrade and equipment line item, with unit cost and quantity
Analyses run in the background, and results are ready within about five minutes. There's no limit to how many times you can tweak and re-analyze a project.
Costs priced from real catalogs
Different territories have different interconnection costs, so estimates are priced from cost catalogs. Gridtwin maintains public catalogs that are applied automatically by utility, substation, and connection type — and your organization can build private catalogs of its own.
Refine every assumption
An analysis is a starting point, not a fixed answer. Edit the project geometry and point of interconnection, draw custom line extensions, override local network values, apply contingency and tax modifiers, or edit the study and its line items directly — then re-run.
Honest numbers: results are screening-level estimates intended to de-risk projects early — they help you avoid infeasible sites and applications, but they're not a substitute for a utility's formal interconnection study.
DER forecasting, year by year
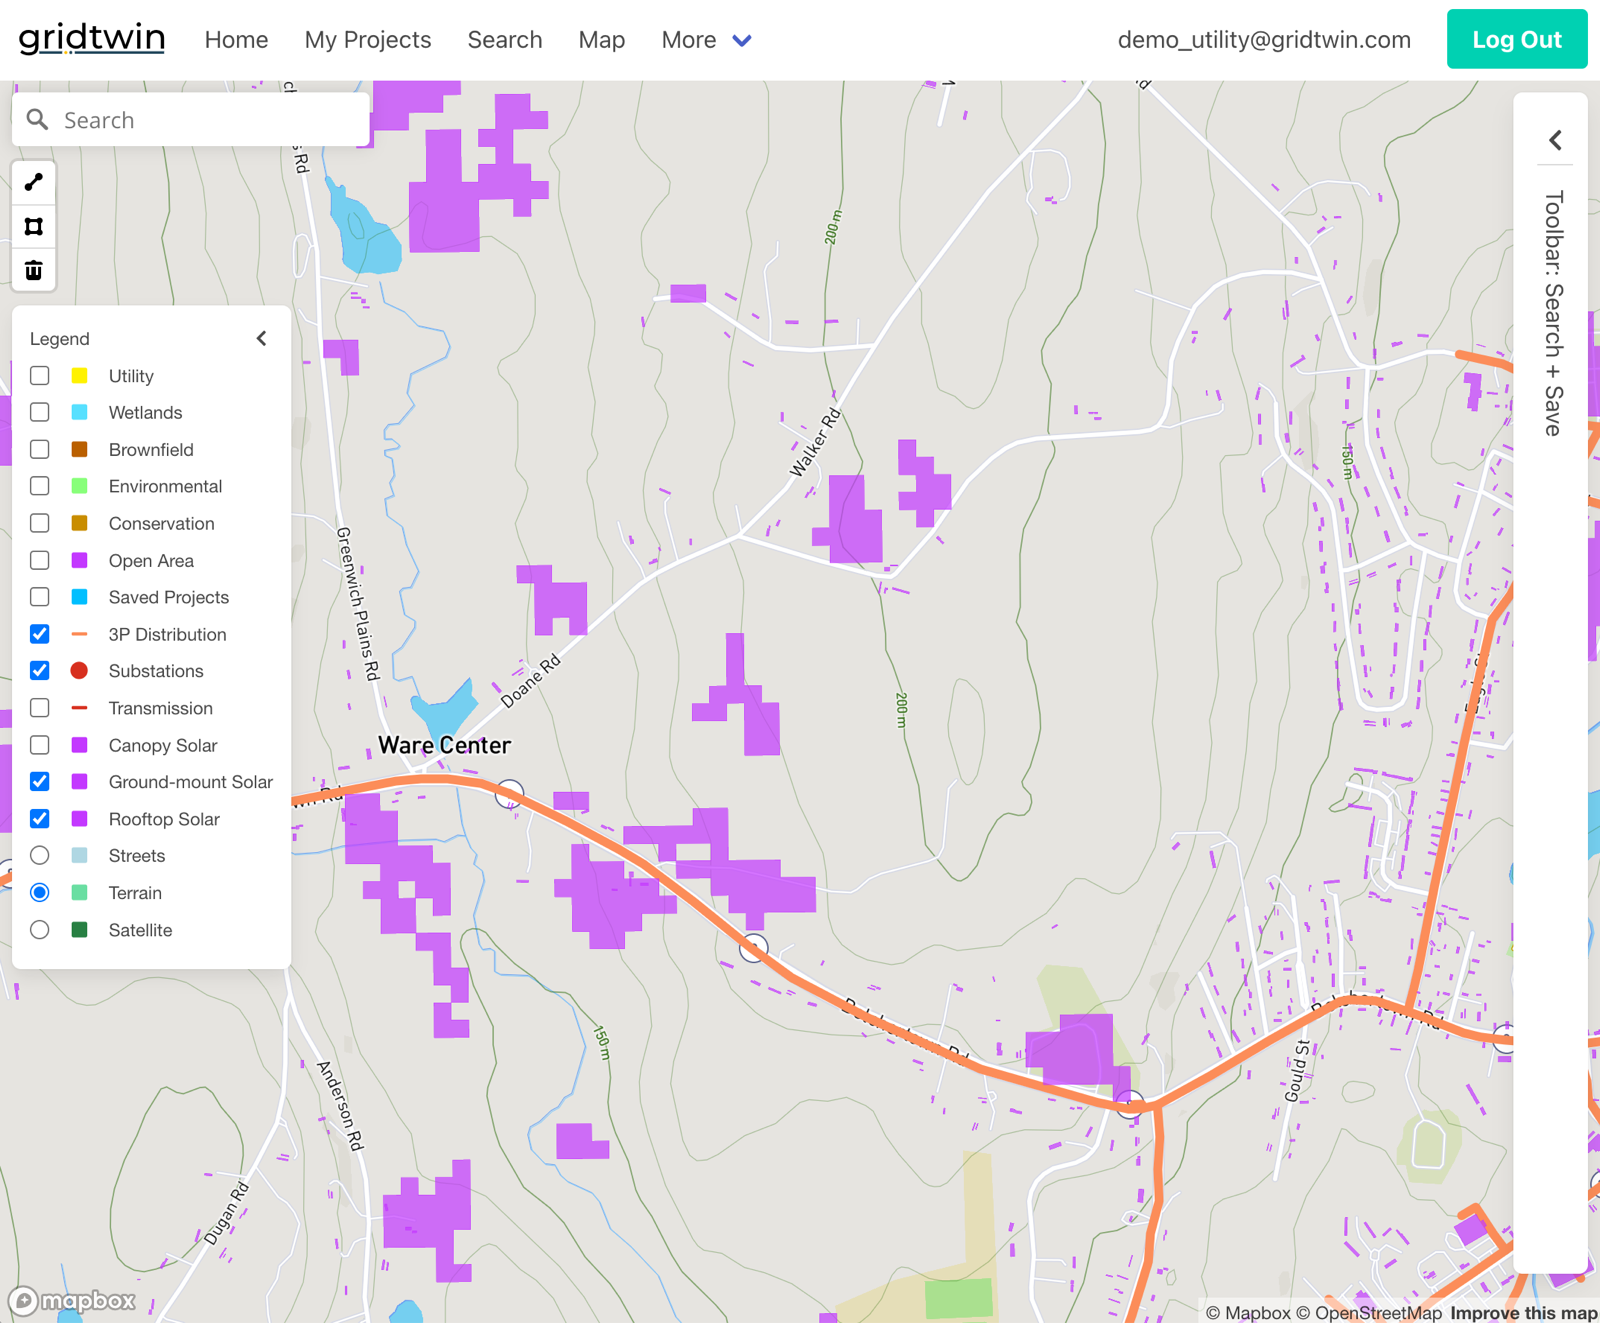
Gridtwin forecasts DER growth by ranking millions of potential projects on their economics, then simulating deployment against the real constraints of the distribution network — a repeatable workflow that replaces months of data gathering and model building.
-
Gather & standardize
Parcels, land use, environmental restrictions, feeder and substation models, hosting capacity, queue data, and cost catalogs — plus your own uploads.
-
Characterize & price
Buildable area, project size, EPC, land lease, O&M, incentives, and interconnection cost — computed into an IRR for every project.
-
Rank
Projects are ranked by economic viability and filtered by size limits and policy or environmental rules.
-
Simulate deployment
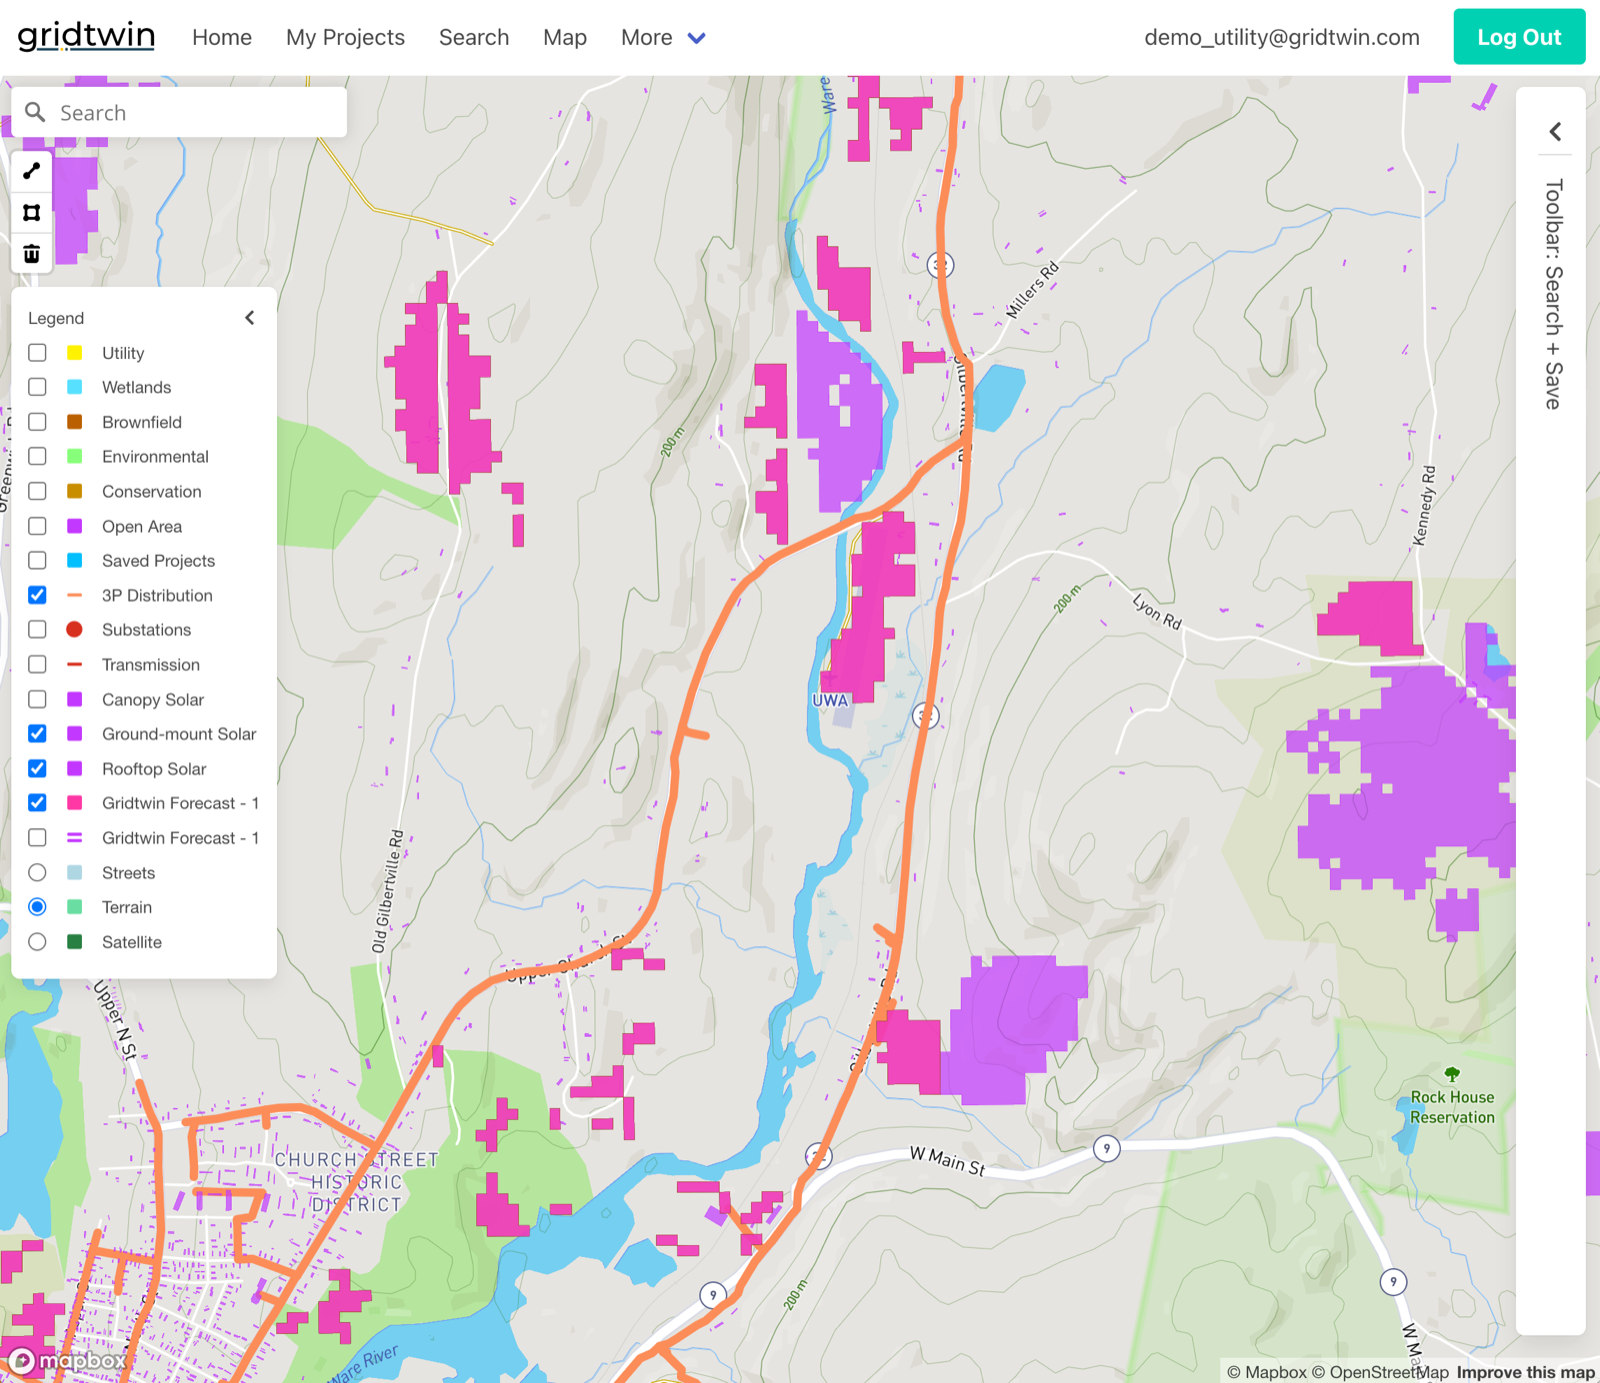
Year by year, the highest-ranked projects attach to the network; loading, interconnection costs, and IRR update as the grid fills.
Real network constraints
Detailed feeder and substation models route new service lines automatically, gate deployment on capacity limits, trigger configurable upgrade costs and timelines, and simulate group interconnection to capture cumulative impacts across the territory.
Every major DER technology
Ground-mount, canopy, and commercial rooftop solar ranked by IRR; residential rooftop solar and EV charging (public and residential) forecast with propensity models.
Outputs you can act on
Review deployment by feeder, substation, and year; see total expected interconnection and network-upgrade costs; build custom project databases; export reports for planning and regulatory use.