Training & Tutorials — For Utilities
Utility administrator tutorials for customizing interconnection, catalogs, and forecasting.
Introduction to Gridtwin for Utilities
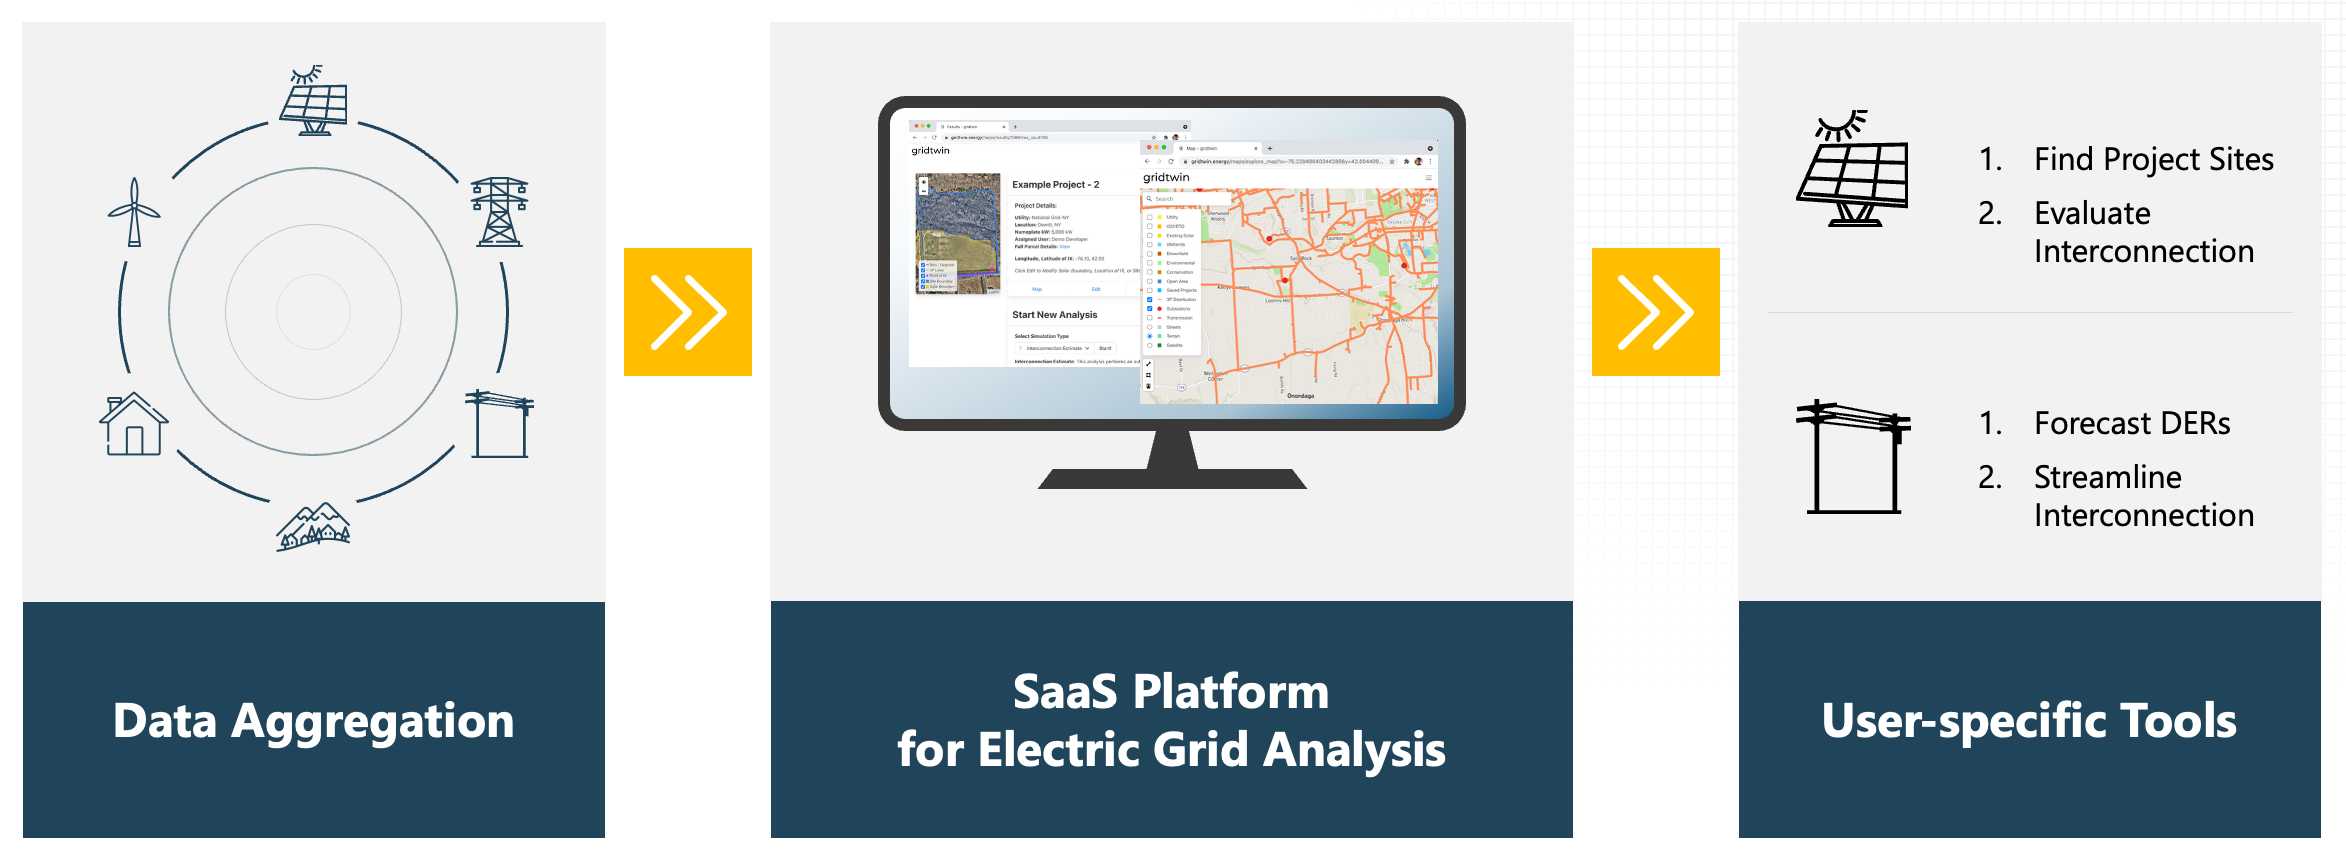
Gridtwin is an electric grid analysis platform designed to help utilities plan, forecast, and evaluate renewable and DER development.
- Find and evaluate project sites
- Assess interconnection impacts
- Forecast DER growth year over year
- Streamline interconnection planning workflows
Steps
- Determine deployment goals based on state-level policy and targets
- Explore example projects in your territory
- Identify priority planning questions
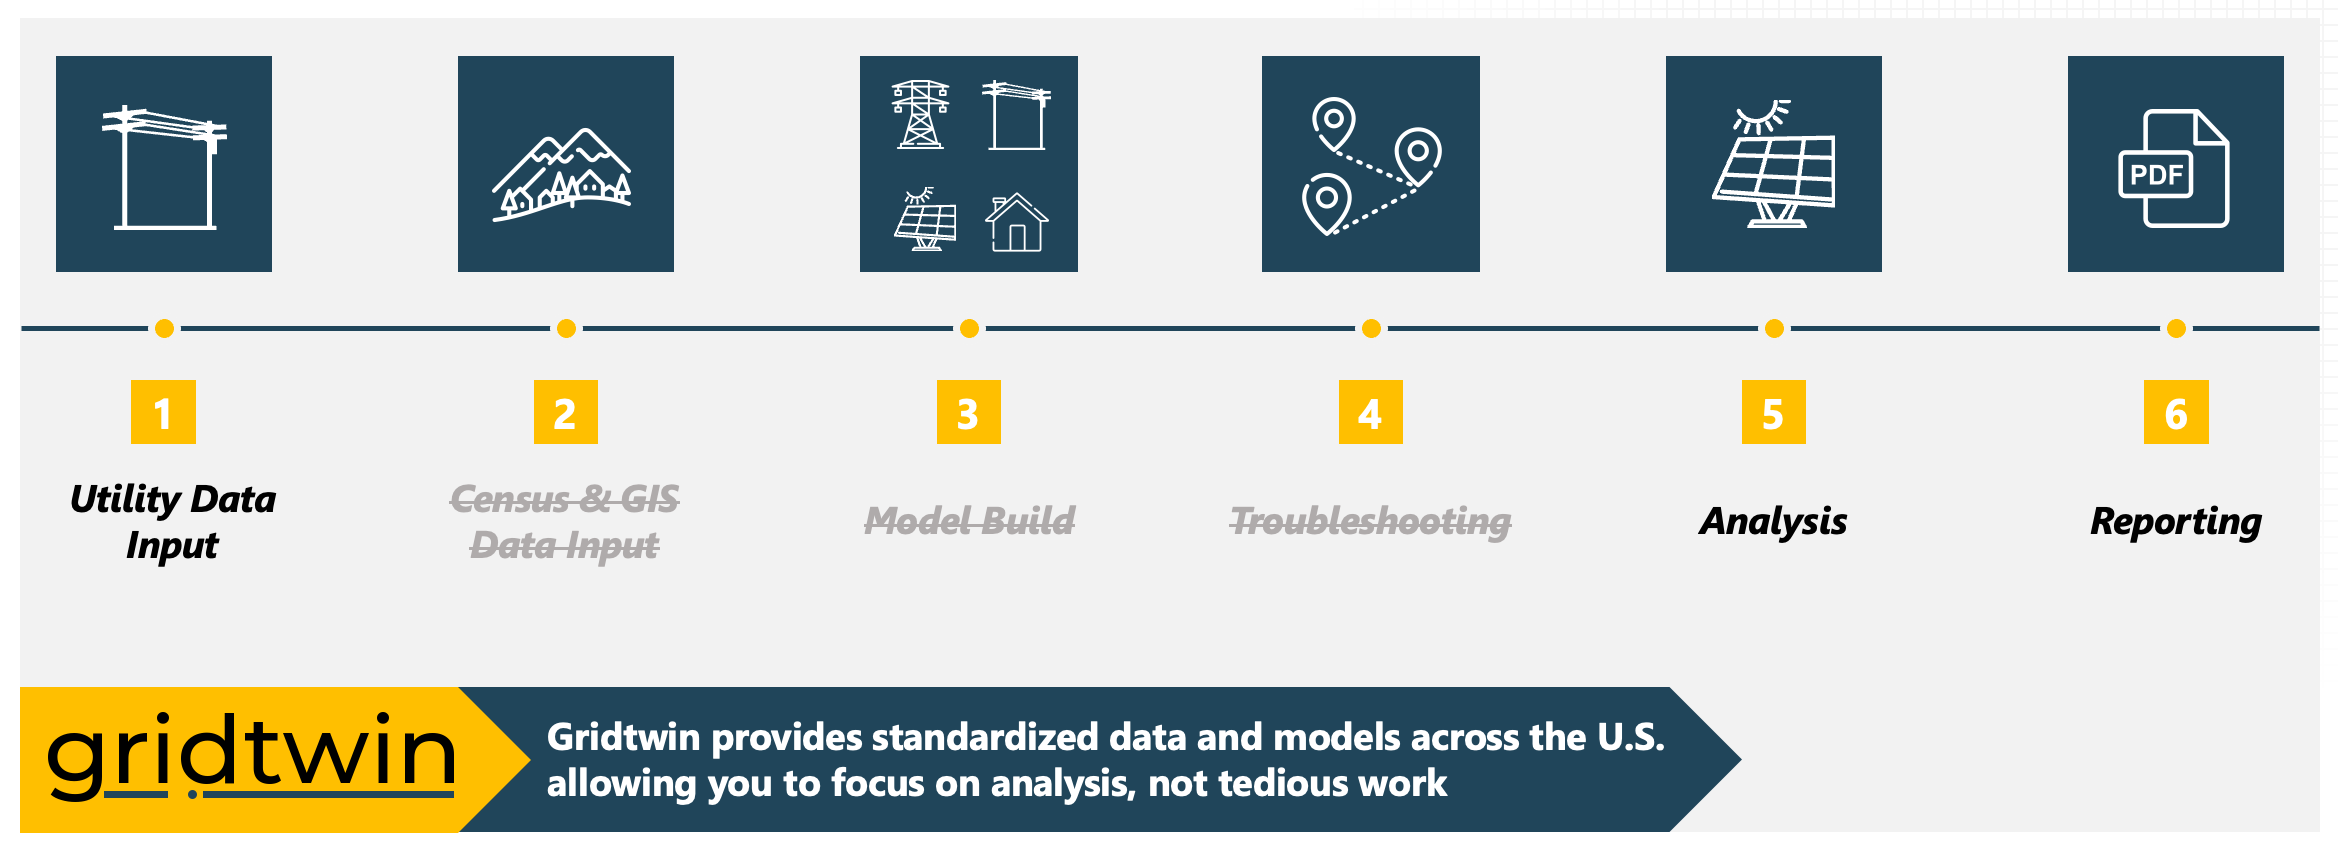
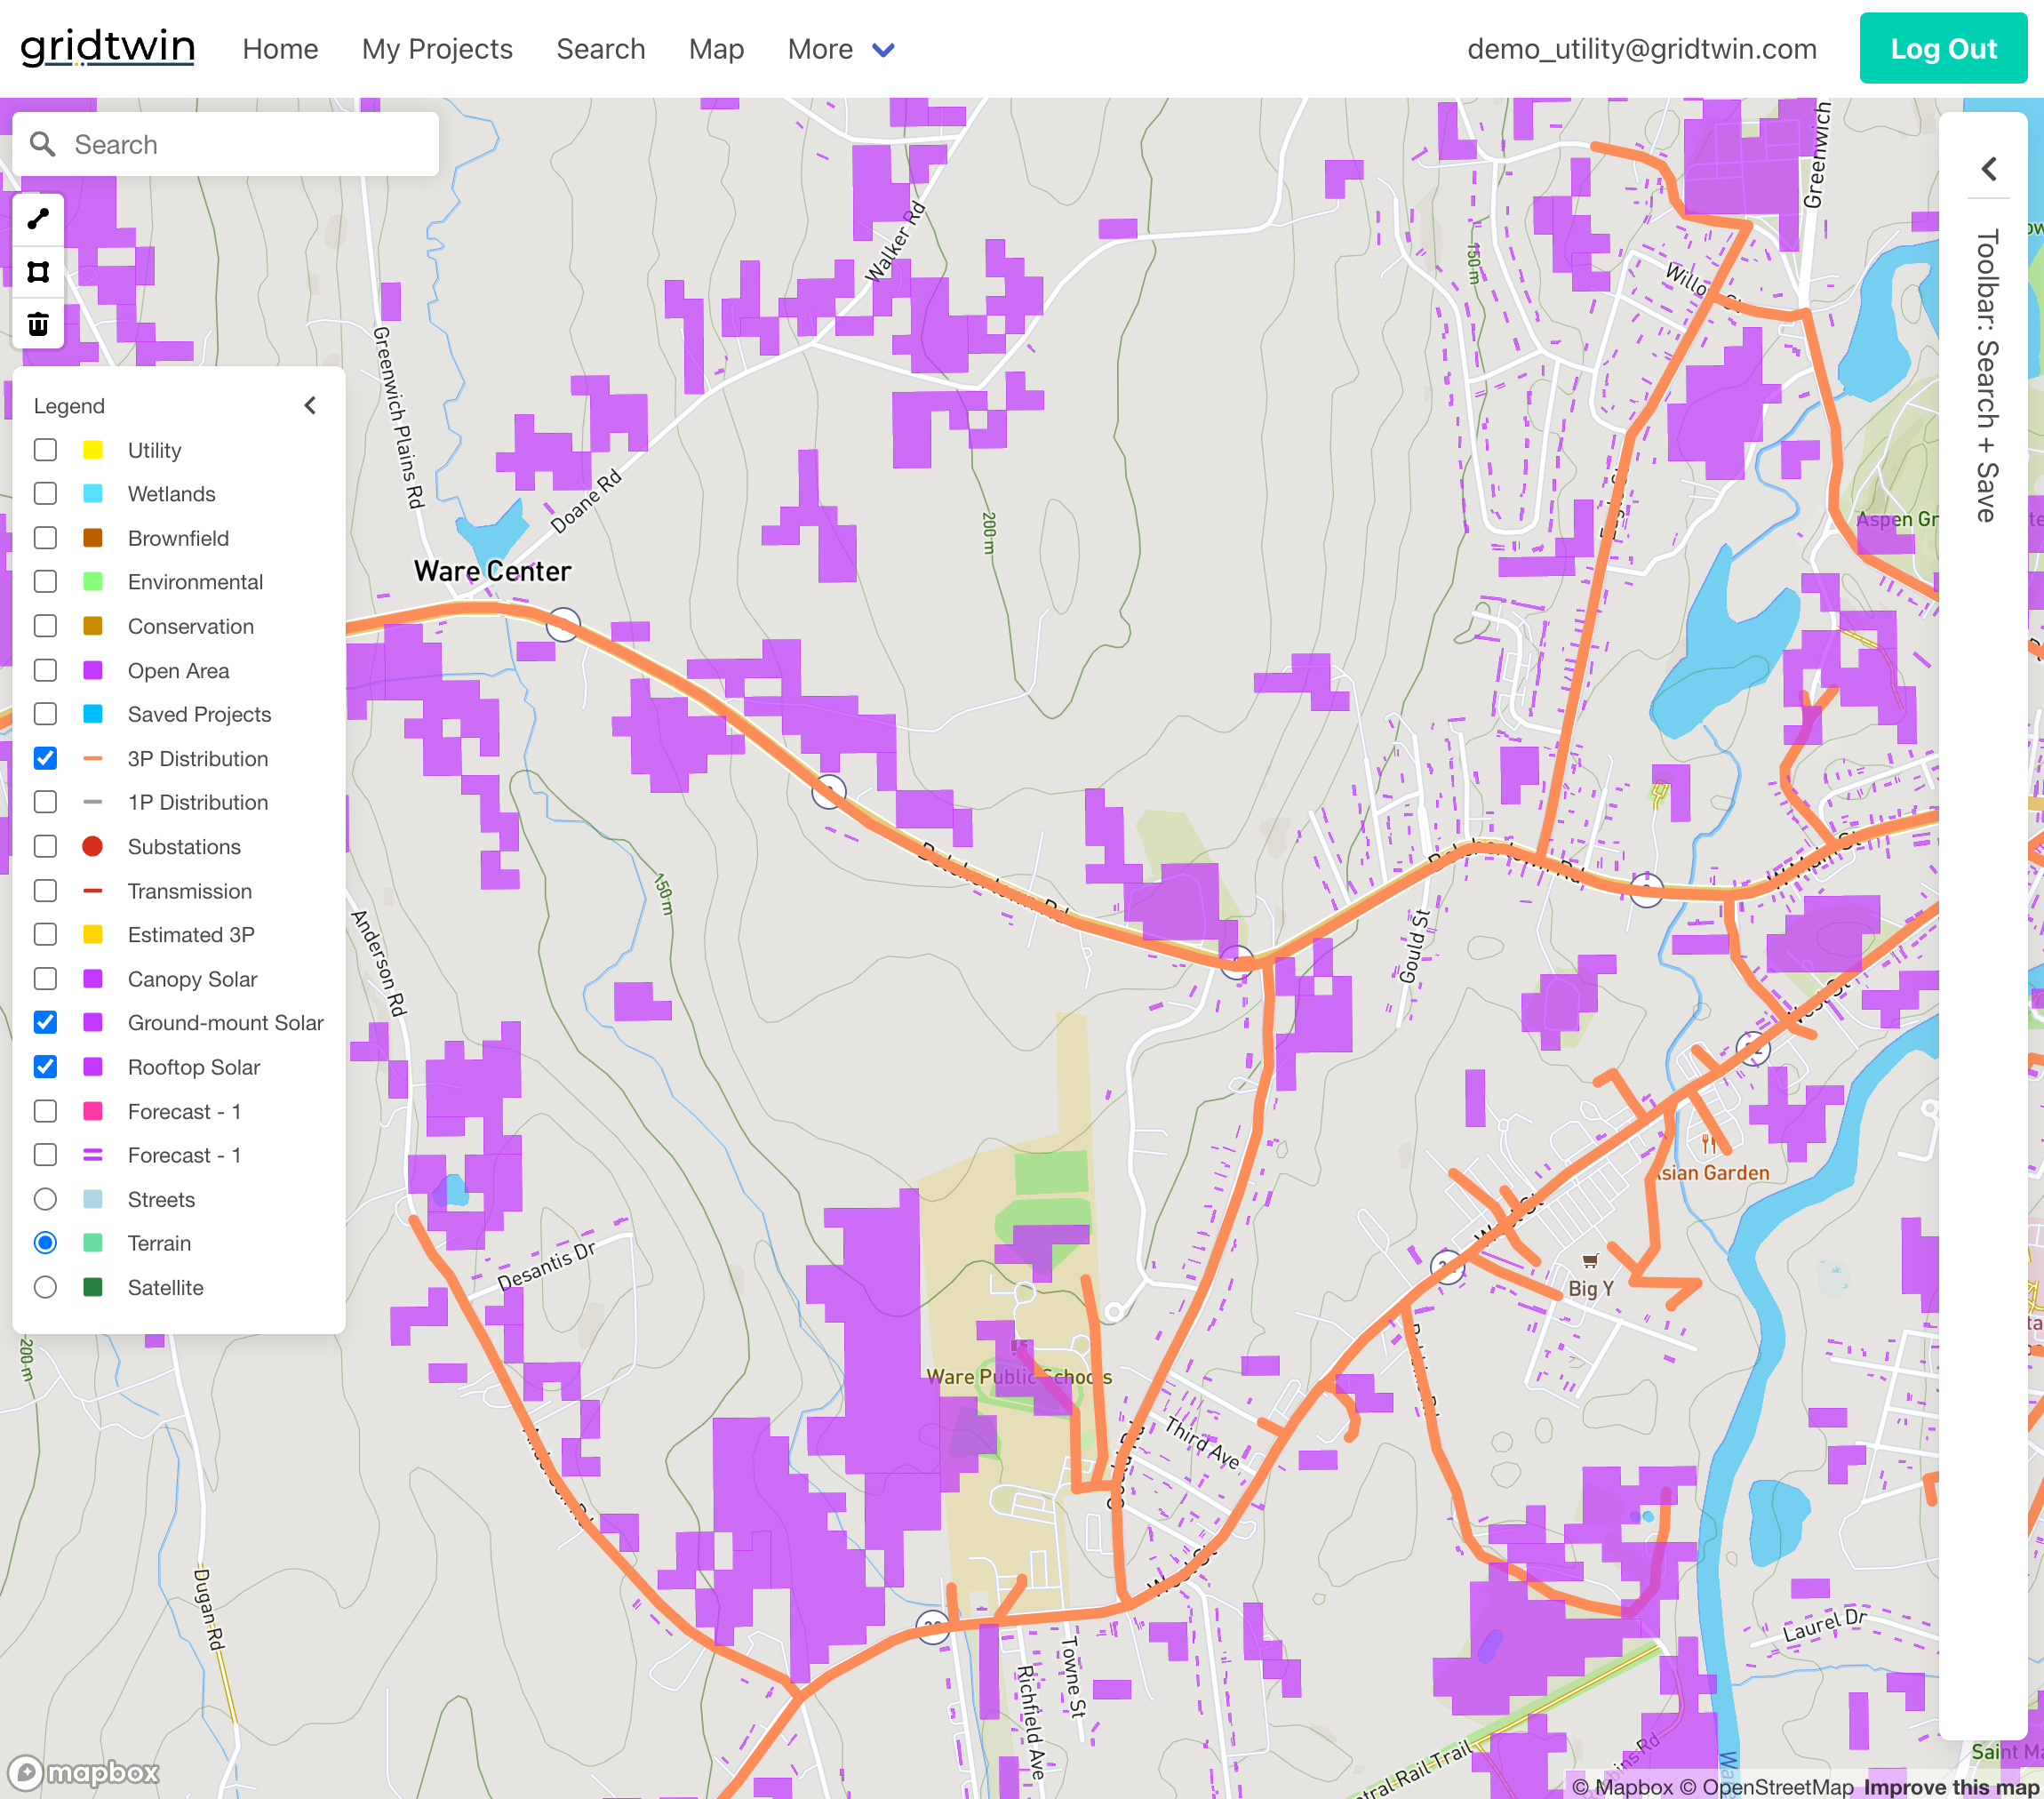
Gridtwin Data Model
Gridtwin aggregates standardized datasets and utility-specific inputs to support forecasting and interconnection analysis.
- Parcel boundaries and land-use data
- Environmental and conservation restrictions
- Distribution network and substation data
- Cost catalogs, hosting capacity, and DER queue data
Steps
- Review standard datasets provided
- List utility-specific datasets to add
- Prepare files for upload
- Plan updates and refresh cadence
Account Creation
Utility users can create accounts and join organizations to access Gridtwin forecasting and analysis tools.
- Sign up using your utility-specific registration link
- Verify your email address
- Enter personal and organizational details
- Join an existing organization or create a new one
- Accept the Gridtwin Terms of Service to activate your account
Steps
- Use the utility sign-up link
- Verify your email address
- Complete your organization profile
- Invite teammates to join
Forecasting Tools Overview
Forecasting tools identify and evaluate millions of potential DER projects across utility territories.
- Custom project datasets for solar and EV charging
- Year-over-year deployment forecasts
- Group interconnection simulation
- Forecast reports and data exports
Steps
- Open Forecasting tools from the menu
- Select DER technologies of interest
- Load the default project dataset
- Execute forecast simulations
- Review results of forecast by feeder, substation, and year

Standard Data Included with Gridtwin
Gridtwin includes extensive standard datasets that can be supplemented with utility-specific data.
- Land-use, elevation, wetlands, and parcel data
- Solar insolation and buildable area estimates
- Distribution feeders and substation locations
- Cost benchmarks, incentives, and revenue data
Steps
- Inspect coverage and vintages
- Note gaps or local sources to add
- Request additions if needed
- Confirm alignment with planning tasks
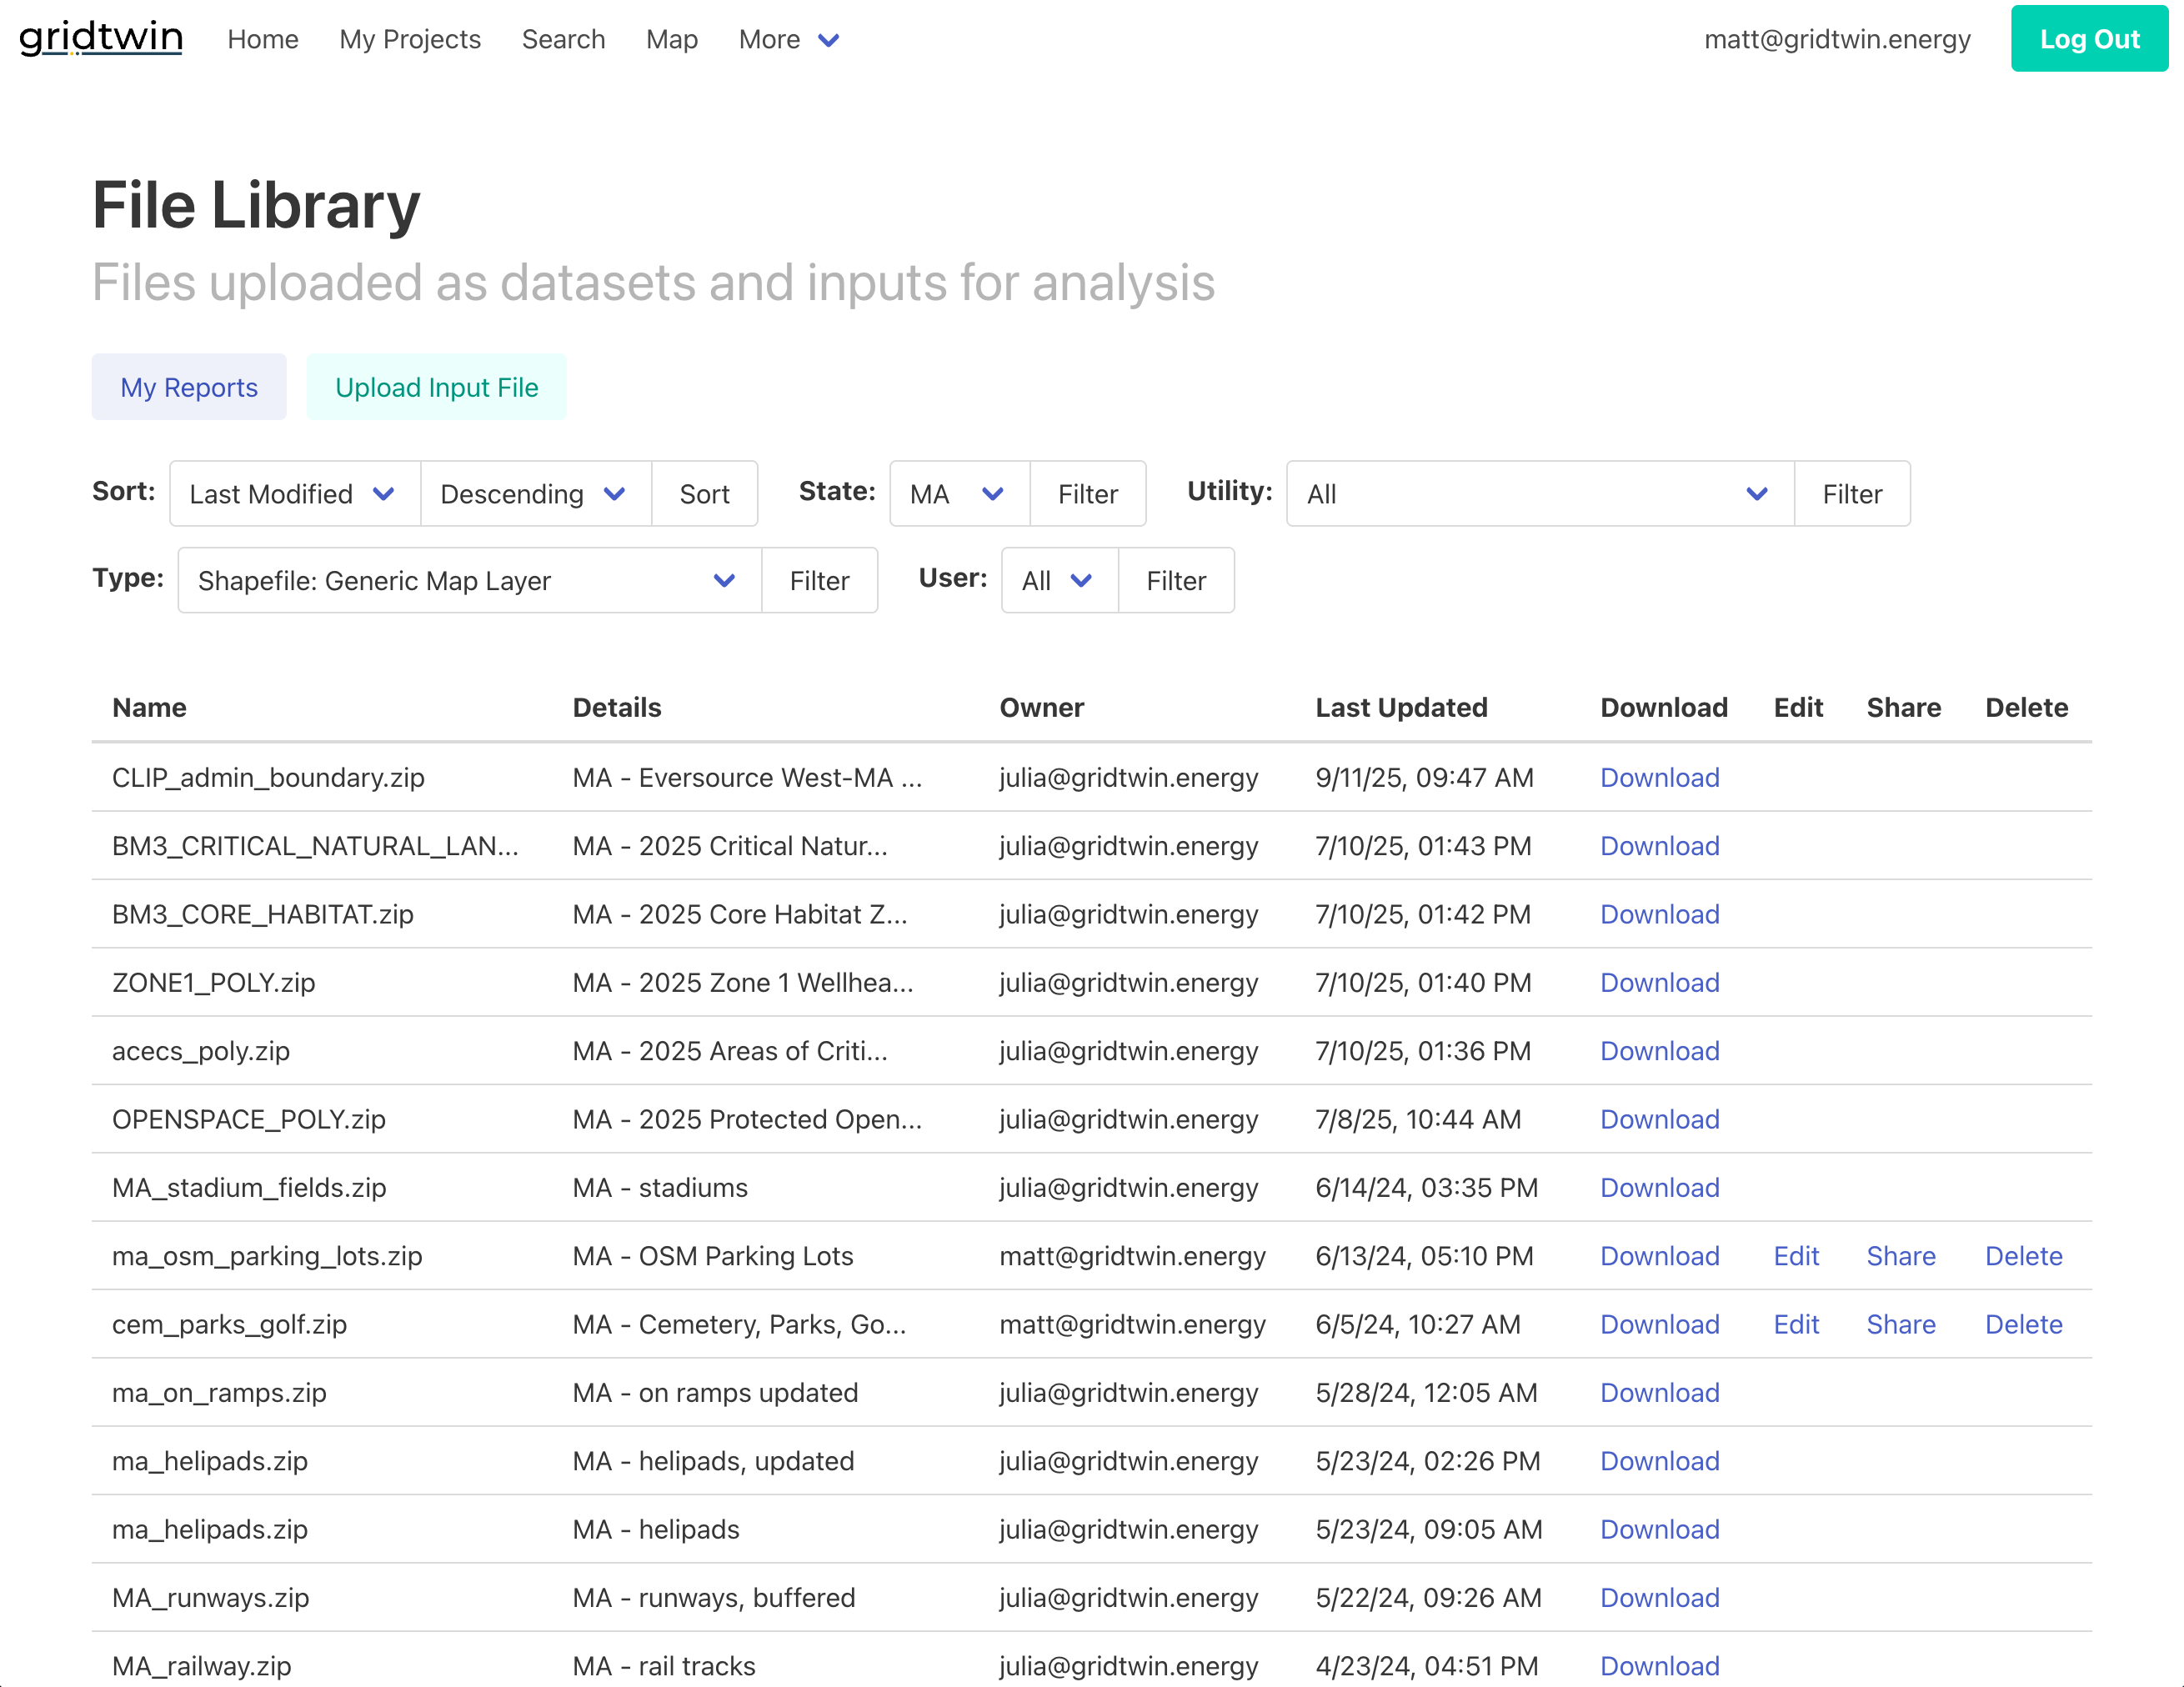
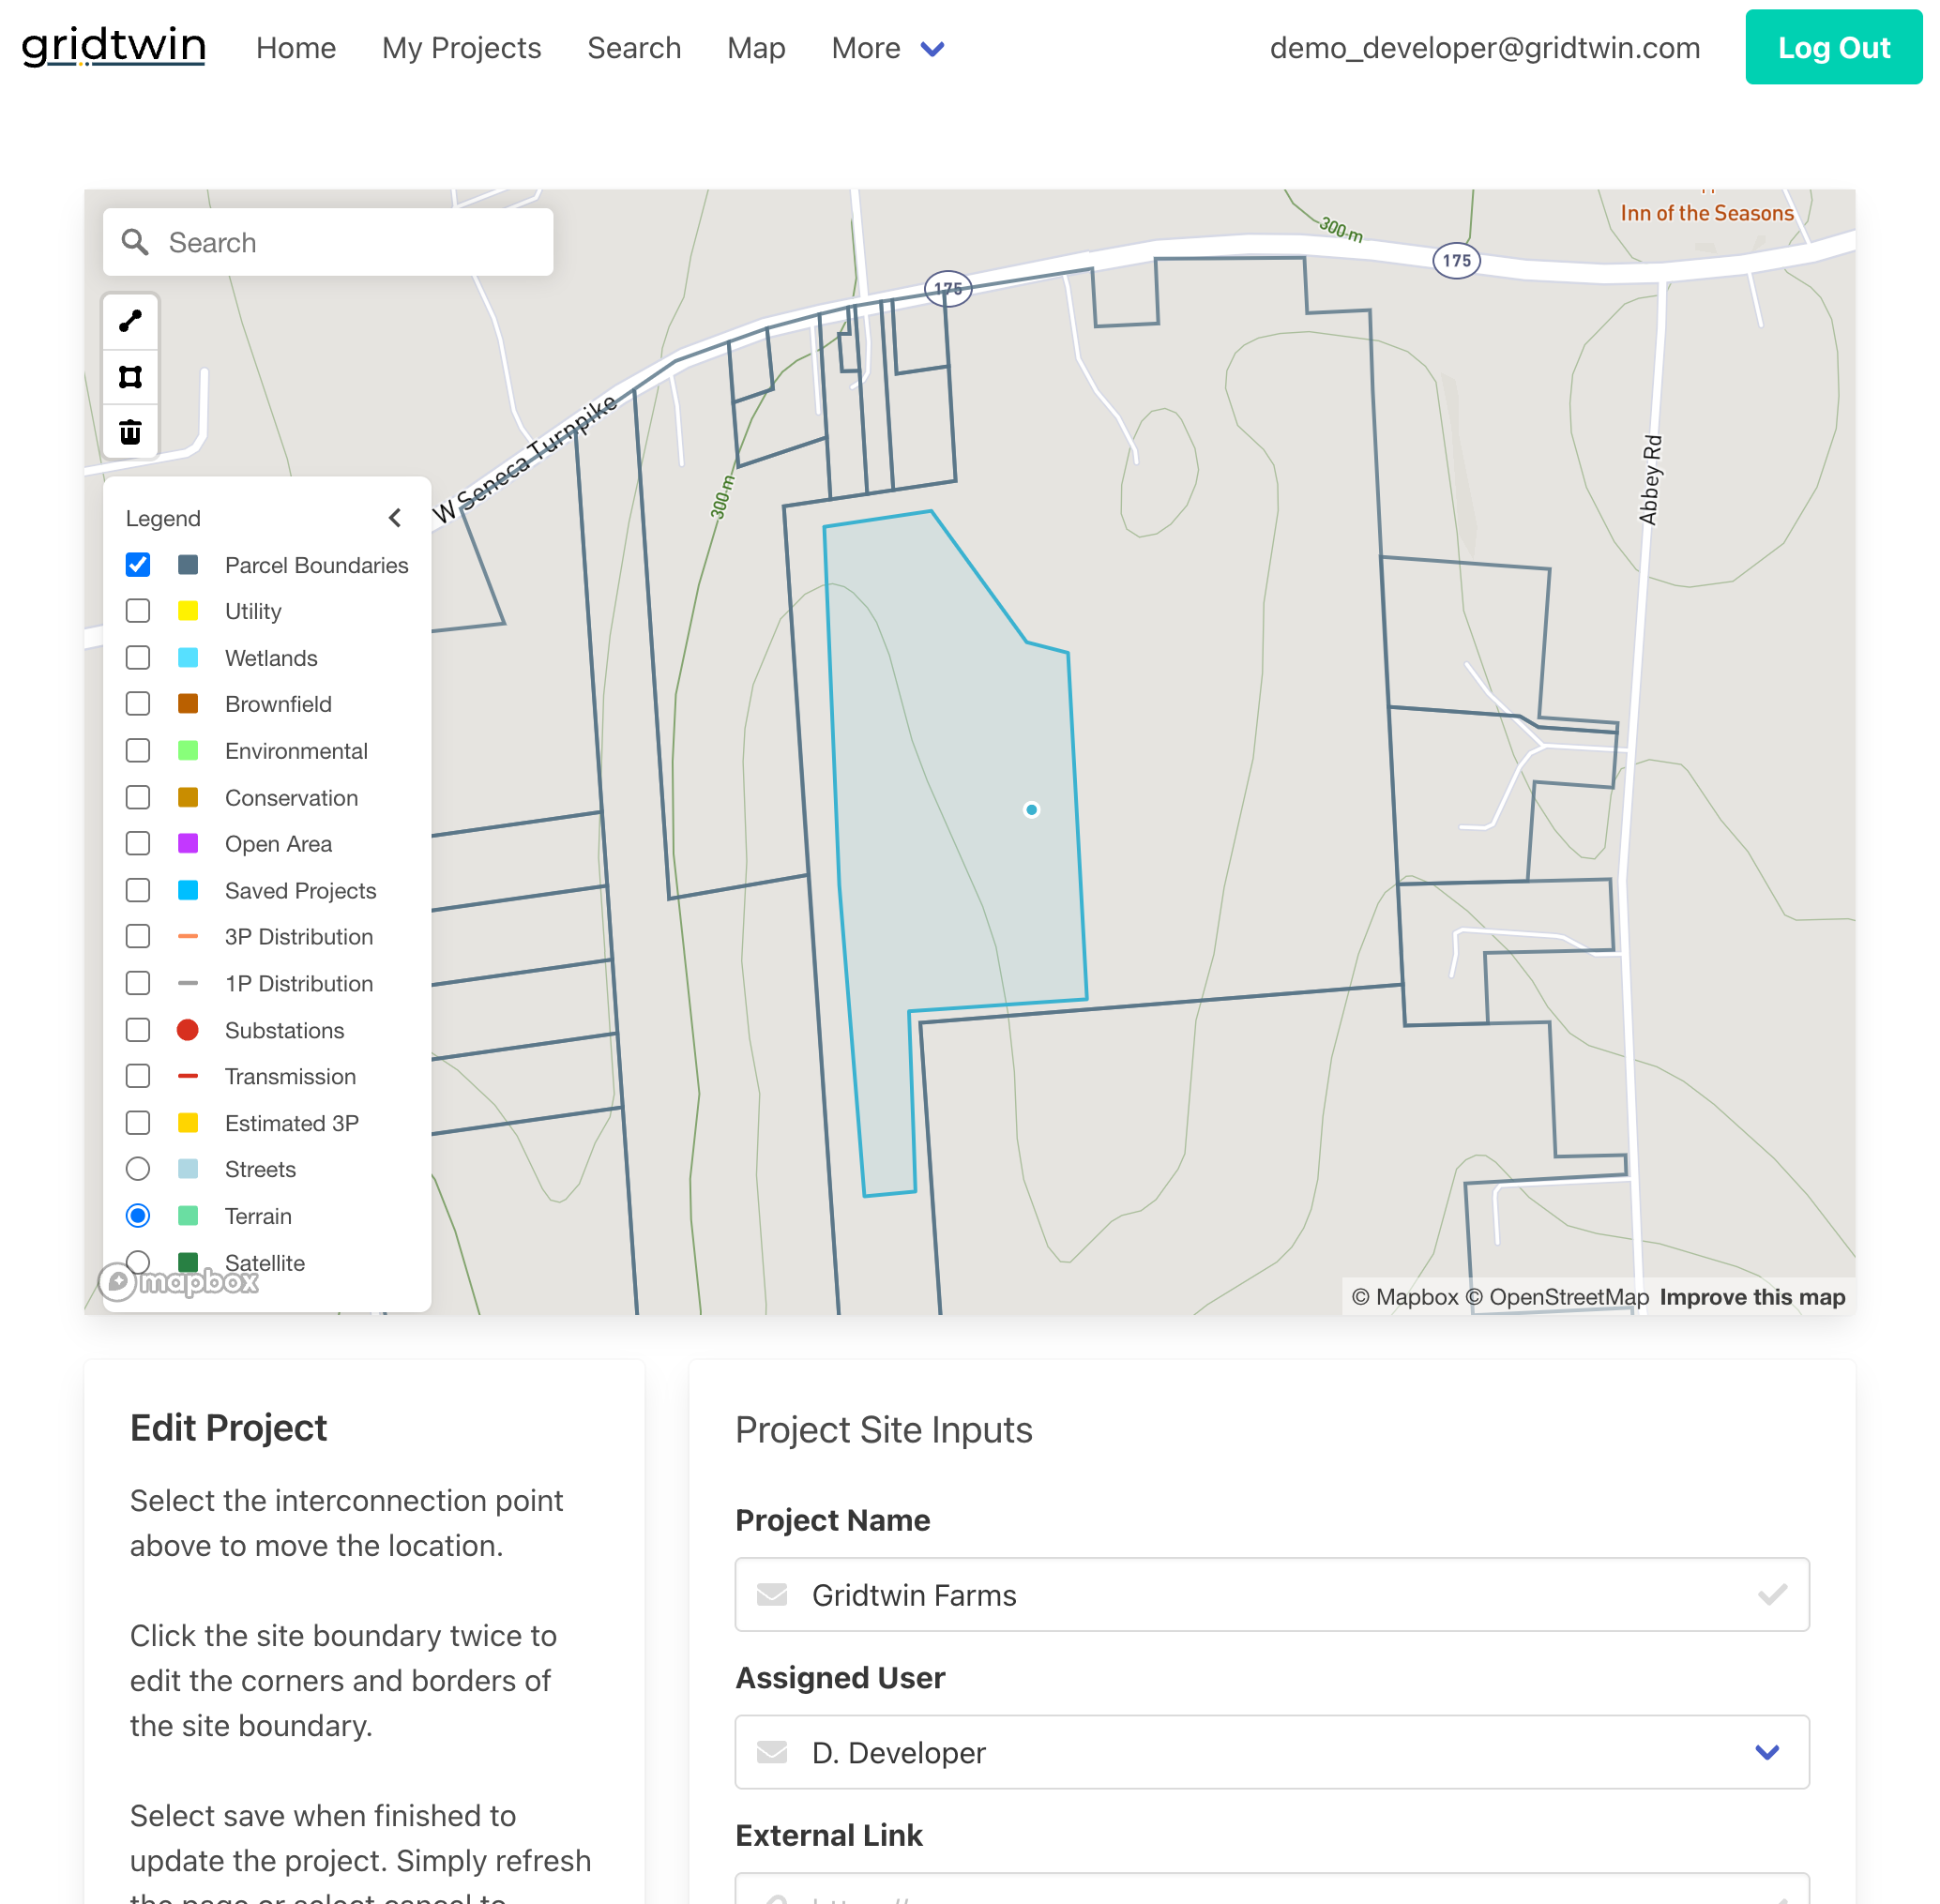
Building a Dataset of Potential Projects
Utilities can process millions of parcels to create custom datasets for forecasting renewable deployment.
- Upload supplemental datasets using the file library
- Apply environmental and land-use filters
- Generate candidate solar and EV projects
- Create custom project scenarios for analysis
Steps
- Upload supplemental files
- Apply environmental and land-use filters
- Generate candidate project sets
- Save scenarios for comparison
Forecasting DER Growth
Gridtwin forecasts DER development by ranking projects based on economics and network constraints.
- Calculate IRR using EPC, land, interconnection, and O&M costs
- Rank projects by economic viability
- Apply annual deployment goals
- Iteratively attach projects to the network while updating capacity
Steps
- Configure economic input assumptions
- Compute parcel-level IRR
- Rank projects by viability thresholds
- Prepare annual deployment lists
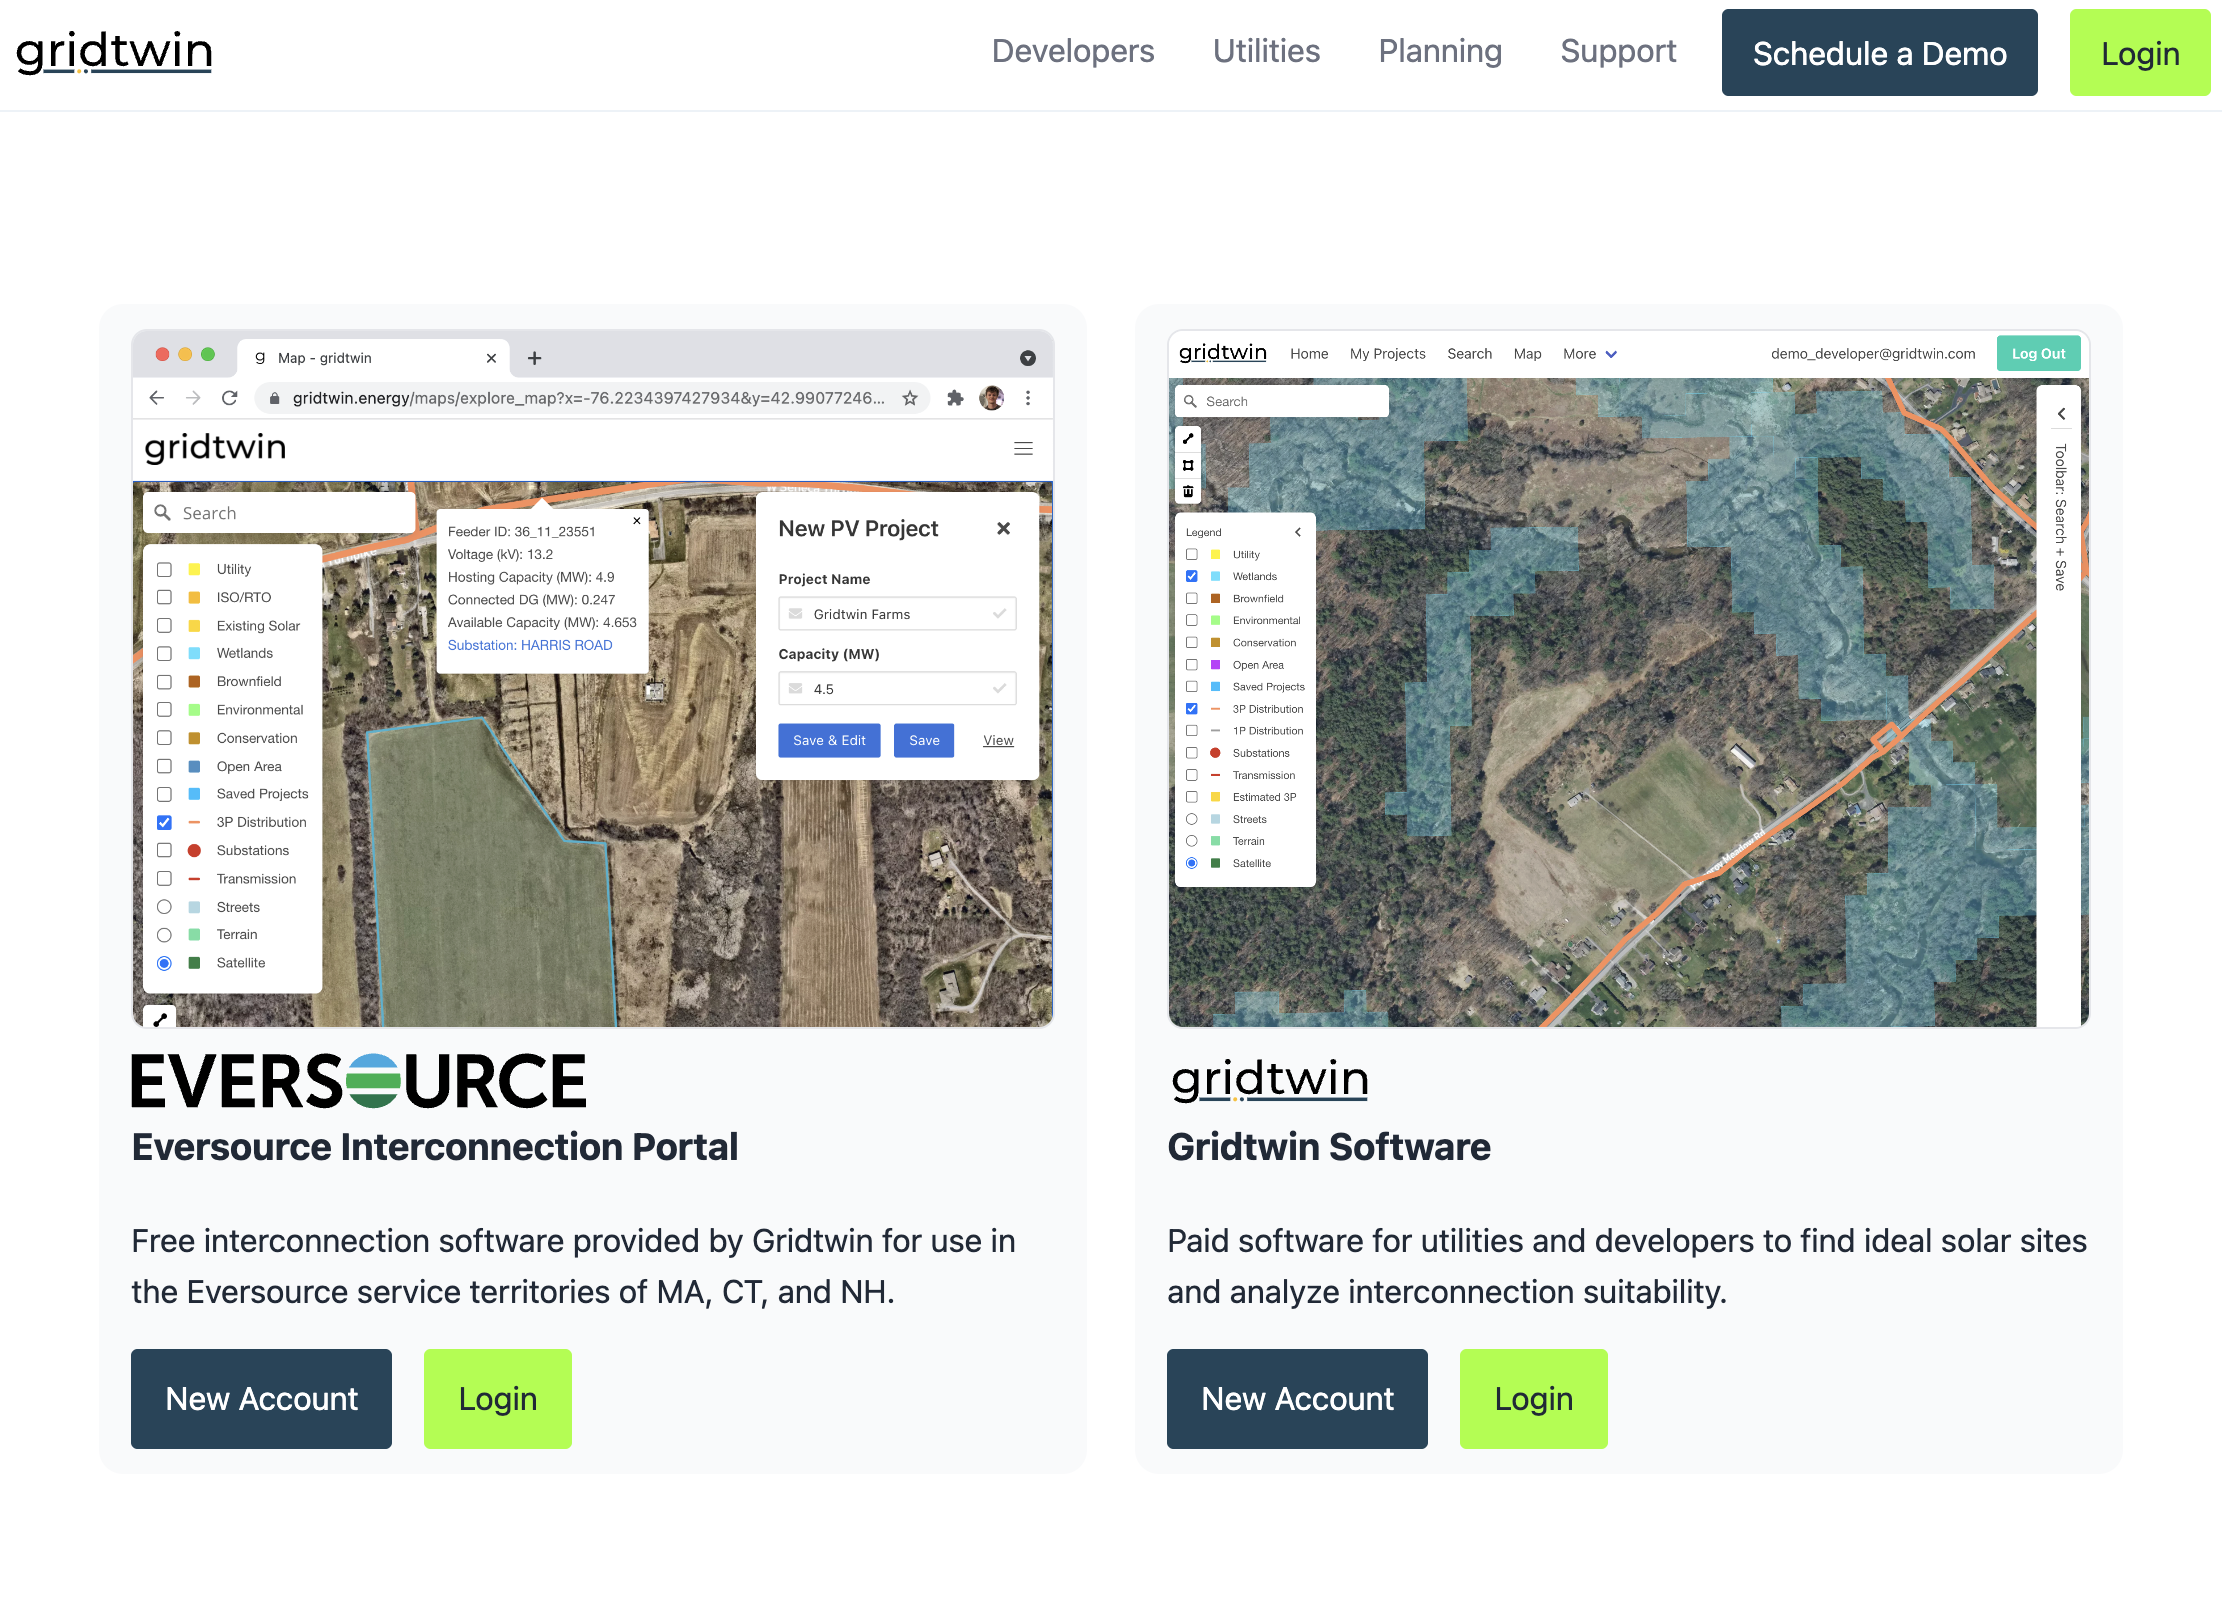
Interconnection Analysis Tools
Detailed network models automatically estimate interconnection impacts and upgrade costs.
- Automated feeder and substation routing
- Utility-specific interconnection cost catalogs
- Detailed line-item cost breakdowns
- Simulation of group interconnection scenarios
Steps
- Open a project's Interconnection tab
- Review routing results and assumptions
- Examine line-item costs and upgrades
- Export results for review
Sharing and Permissions
Utilities control access to reports, datasets, and files through role-based permissions.
- Share reports with read-only or owner permissions
- Control file access in the file library
- Add multiple owners to enable collaboration
- Manage organization-wide visibility settings
Steps
- Open Sharing settings for a report
- Set roles and visibility as needed
- Add additional owners if required
